
A Focus on EURGBP
The EUR/GBP or the cross as it is also referred to in the FX markets has become very interesting of late. We highlighted at the beginning of this week that GBP/USD was outperforming EUR/USD and that led to an interesting subplot in EUR/GBP. For the past number of weeks EUR/GBP threatened to break out above 0.88, as we trade on a high 0.87 handle. Better than expected UK data however in Nov had seen this trend reverse, as we traded back below 0.87. Going into this week the all-important support level 0.8650 was fully in view. We took out this support level yesterday, as lower than expected inflation report was released from the Eurozone, which saw Euros sold across the board.
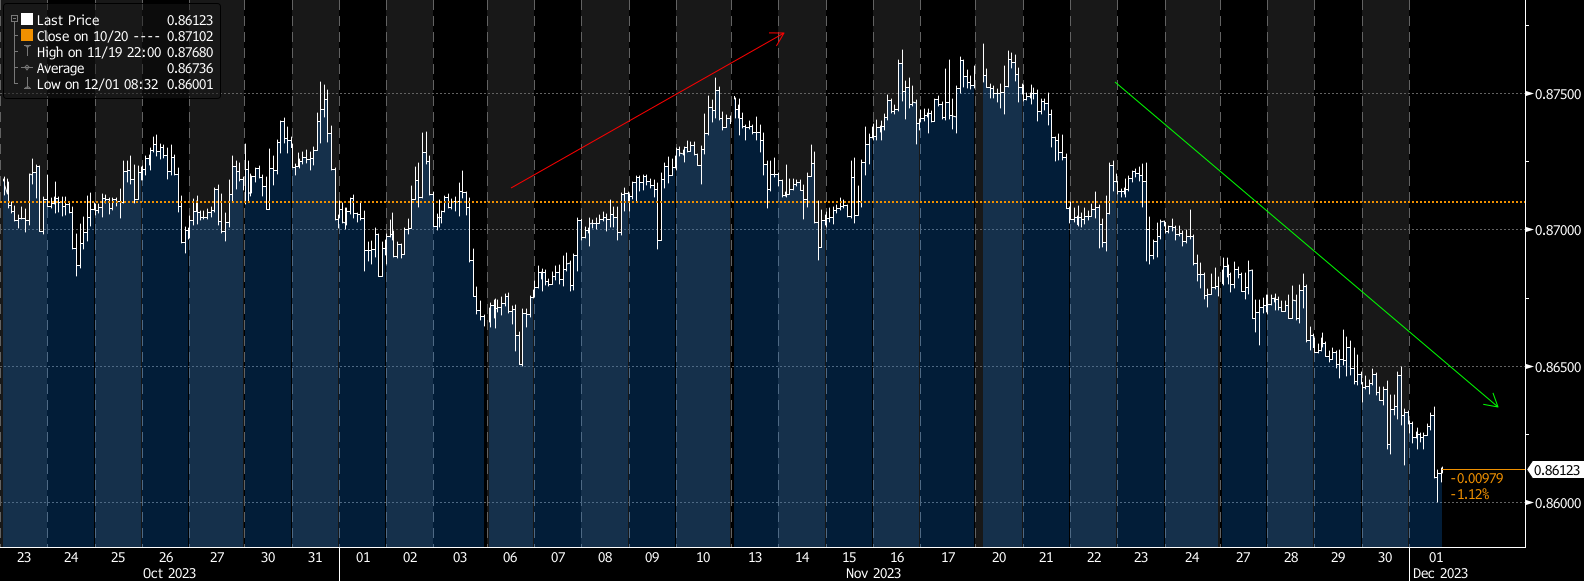
EUR/GBP – 30 day chart of EUR/GBP – we can see how improving UK data released mid Nov initially turned the higher trend in EUR/GBP – red arrow. This was compounded yesterday with the weak Eurozone inflation report, Euros were sold.
If we take a step back and look at the yearly chart of EUR/GBP we can see that we are right in the sweet spot to buy Euros and hedge EUR/GBP exposure. Over the past 10 days we have sold off nearly 2.00% in EUR/GBP and currently sit right on support at 0.8600. The 7 month range in EUR/GBP has been 0.8750 – 0.8500. The median of this range has been 0.8625. A weekly close below 0.8600 would indicate further downside momentum into next week, however when looking at the below medium term chart, we can see the value in EUR/GBP at its current levels.
