EUR/GBP – Where To Now?
EUR/GBP, GBP/EUR or ‘’The Cross’’ as it is known amongst currency traders –
EUR/GBP or GBP/EUR, as many of our clients like it quoted as, is a heavily traded currency pair, opening up trade between the EU and the UK. Vast volumes go through this currency pair on a daily basis in the FX markets, with many industries and their profits hugely sensitive to fluctuations in this exchange rate.
In this week’s currency report from Treasury First, we look at the performance of EUR/GBP over the course of 2022 and hopefully garner some insights into its future path into year end and beyond into 2023 – we feel the 0.8600 level in EUR/GBP holds the key here.
We started 2022 with GBP/EUR trading at the lofty heights of 1.20 level – making exporters of goods into Britain from the EU very competitive indeed – we had not been at these levels since 2016 – pre Brexit vote.
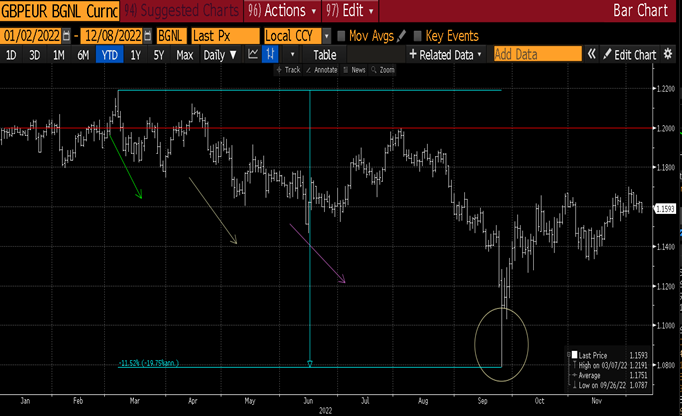
This trade began to lose momentum post the Ukraine invasion by Russia and the old ‘’risk off’’ dynamics of the financial markets kicked in. GBP/EUR began to head south as we can see from the chart below.
GBP/EUR – begins to lose topside momentum in March 2022, moving off the 1.20 level – red line on chart and heads south, as financial markets trade in ‘’risk off’’ mode following the Ukrainian invasion. By the end of the summer focus has now firmly shifted to the UK itself and the weakening economic backdrop – see circle highlighted on the chart – showing GBP/EUR dipped below 1.08 – from the 1.20 level at the beginning of the year – falling over 10%
EUR/GBP –
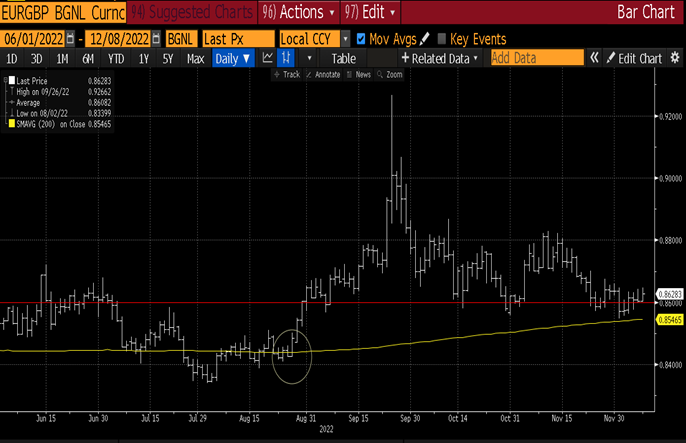
In EUR/GBP terms the 0.8600 level has been pivotal over the course of 2022, as the currency pair has oscillated around this zone. As can be seen from the chart below – the red line has defined us for this year’s trading – spending the majority of the year below 0.8600 – Euro weakness and Sterling strength – until finally the focused shifted the UK economic fundamentals in late Aug. From Aug onwards we have spent the majority of our time above the 0.8600 – classic case of old resistance, now acting as new support for the currency-
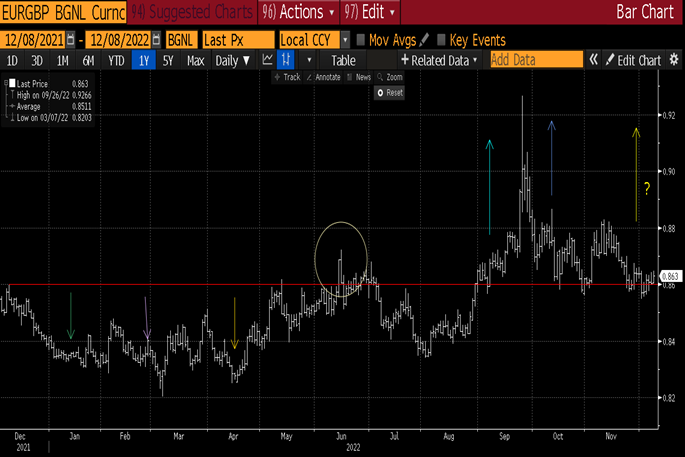
The longer we remain above this red line – 0.8600 in EUR/GBP terms and 1.1628 in GBP/EUR terms, the higher the probability that renowned topside momentum enters the market and takes us higher in Euro versus Sterling in the coming months.
So what should we be looking out for into year end and beyond?
Firm weekly closes in the currency pair above 0.8600 would indicate to us that the path of least resistance is higher and that we could see a significant break of the range that defined us in 2022 and a move in the 0.9000 zone or 1.11 in GBP/EUR terms.
However a weekly close below 0.8600 and weekly close below the 200 day moving average – yellow line in chart below –which we have not been below since Aug 2022 – would be a very bearish signal and should indicate a move back towards 0.83-0.82 zone or the 1.20 level in GBP/EUR terms.
EUR/GBP – the two bearish indicators to watch – a weekly close below both the 0.8600 level and the 200 day moving average would indicate a move back to the 0.8300-0.8200 zone or 1.2000 level in GBP/EUR terms.