
Fickle FX Markets, Why is the Euro Weakening?
Why so weak……? The single currency (EURO) takes another lurch lower versus the Dollar and Sterling.
How fickle these FX markets can be and how quickly they can reverse current trends. As we have mentioned on numerous occasions now, we envisage this FX volatility to increase over the coming years, as Central Banks battle with interest rate hiking cycles and the ever-growing global inflationary fears.
Just last week we spoke about Euro strength versus the Dollar and Sterling – in particular as EUR/GBP was banging up against the top of its yearly range and primed to break out above 0.8500 or in GBP/EUR terms, below 1.1765. Just 7 trading sessions later and the picture is very different, as EUR/USD sits just above the 1.08 level, the lows seen during the earlier stages of the Ukrainian war and a level not traded below since earlier 2020.
EUR/USD Long Term Chart –
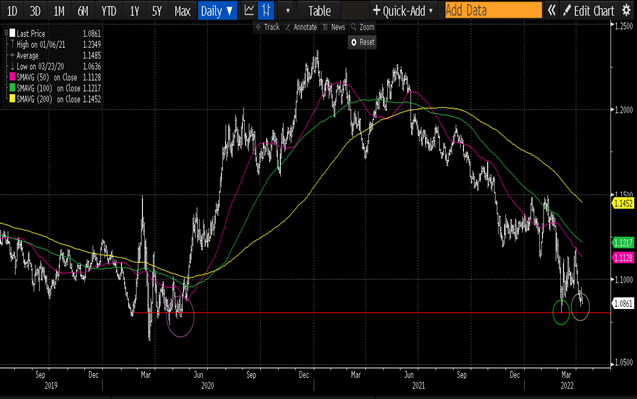
The past 7 trading sessions have brought the perfect storm for a weaker Euro. The US yield curve – the market’s expectations of interest rates in the US – has rallied significantly over this period – the expectation of higher interest rates in the future has increased. The catalyst for this move was a speech from Fed Vice Chair Brainard this day last week – where she suggested the US interest rate hiking cycle and the reduction of the Fed’s balance sheet might be more aggressive than the market had currently priced in. This move in US yields fed into the currency and the Dollar rallied across the board. This came as Europe grappled with Russian oil sanctions and the first round of the French presidential elections – both of which increased the fear premium in the Euro – adding selling pressure. To add to its woes the single currency battled news of further lockdowns in some major cities in China due to Covid – this muddies the future global growth story and tends to affect Europe first.
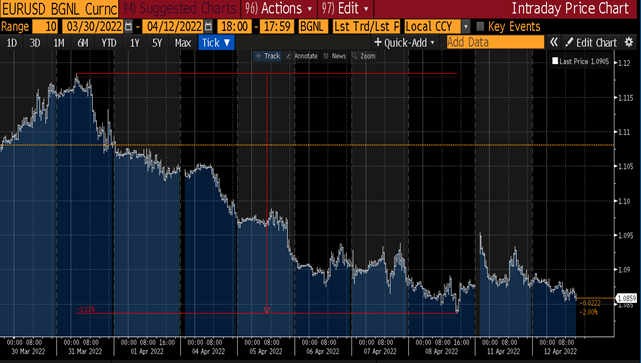
EUR/USD – Short Term Chart – 1.1190 down to 1.0840 – over 3% in 7 days.
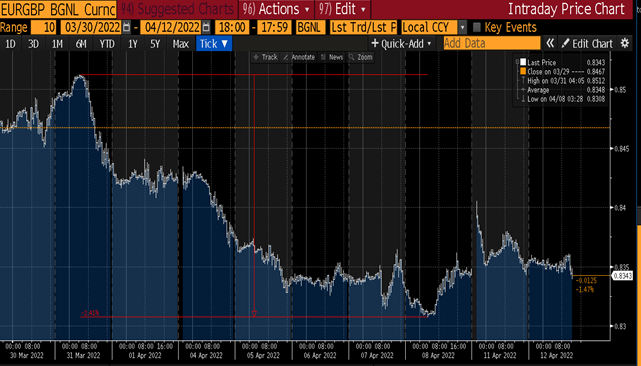
This weakness fed into EUR/GBP also, as the market was caught long towards the yearly highs of 0.8500 in anticipation of a break of the recent range.
EUR/GBP – Short Term Chart – 0.8500 to 0.8300 the recent range
So once again we found ourselves watching major levels in EUR/USD and EUR/GBP – however this week on the downside. Watch a break and daily close below 1.08 for further momentum to the downside in EUR/USD and a break and weekly close below 0.8300 in EUR/GBP for a continuation of the recent trend lower.
Disclaimer
The content of this report is for information purposes only. Nothing in this report should be considered financial, investment, legal, tax or other advice nor should it be interpreted as a recommendation to buy or sell foreign currency or any other products or services. Readers must carefully make their own decisions based upon their specific objectives and financial positions.
Treasury First is powered by Assure Hedge (UK) Limited, a company incorporated in England and Wales (No.10723112) with its registered office at 45 Eagle Street, London WC1R 4FS, UK, is authorised and regulated by the Financial Conduct Authority of the UK (FRN:783837). Assure Hedge Limited, the parent company, is incorporated in Ireland (No. 578153) with its registered office at Dogpatch Labs, CHQ Building, North Wall Quay, Dublin 1, Ireland.