
Month: August 2021
Mid Week Macro Report 25 August 2021
Treasury First – Mid Week Macro Report 25 August 2021
The main story for markets this week is the annual Jackson Hole symposium which is starting tomorrow and represents a key risk event for markets. Historically this meeting of global Central Bankers in the US has brought with it some major monetary policy announcements and in early summer, the markets had teed up this risk event as a possible vehicle to announce a reduction of QE (tapering) from the US Federal Reserve. The decision was made to take the event virtual at the end of last week as local conditions in Wyoming were categorised as high risk due to increasing covid 19 cases in the state and the county where the event was scheduled to take place. This came as FED Member Kaplan softened his stance on tapering highlighting the risks posed by the virus last Friday – Kaplan is a known hawk on the committee, so the markets have read this as a signal that the core dovish message of the Fed will prevail. The US equity markets took this combination of signals to mean that a significant delay to tapering was a high probability and have subsequently rallied after selling off aggressively last week on the risk off sentiment that engulfed the markets. As we approach the start of the event US equities are trading at or close to all time highs and this may be rebalanced to a less risky position heading into the event today and tomorrow. The US bond markets are already adjusting to factor a more balanced announcement from the Fed, as 10 Year US Yields creep above 1.3%. The market feels somewhat complacent towards a less dovish/more balanced view out of Jackson Hole and we feel this is where the risk lies – in this scenario, we would see a rally in the Dollar, as US yields rise and a subsequent sell off in US equities – watch this space over the next few days……..
EURUSD
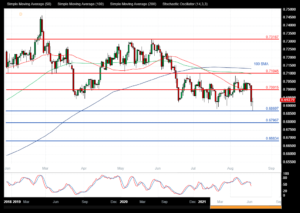
The EURUSD FX pair is trading at 1.1740. Price is above its supporting 1.1700 area. Price tested resistance at the 1.1900 level in July creating a lower area of resistance at the 50 SMA and then sold off. The pair is trending since then with a downward bias. Price is using the 1.1800 area as resistance in the short term. A confirmed breakout above this level and the 50 SMA opens the way to resistance at the 1.1850 area followed by 1.1960 and the 200 SMA. The 100 SMA at 1.2000 area provides a target along the way to the 1.2050 area. Alternatively, a move back down under 1.1700 and the 1.1660 zone opens the way to support at 1.1600. The 1.1529 area support is followed by further supports at 1.1400 and 1.1365.

Wall St 30 Index
The Wall St 30 Index created a new high at 35650.00 last week and is now testing the 35400.00 area as resistance as price action remains bullish. If the market breaks above the resistance area, the way opens to 36000.00. Further resistance comes onto the chart at 36234.00 and 37000.00. The market is creating higher highs and higher lows using the 100 SMA and the trend line as support at 34500.00. Alternatively, a move back below 34500.00 signals a test on the support at 34100.00 The 34000.00 then becomes supportive followed by the 200 SMA around 33350.00. Below this level, the 33025.00 area would be used as support as a significant higher low.

Gold
The Gold chart is showing how the precious metal has traded higher over recent days with the price now trading at 1792.00. The 1810.00 level is expected to act as resistance in the short term. A break above this level would find resistance at the 100 SMA around 1817.00. A continued move higher finds more resistance around the 1833.00 area which held price in July and August. Alternatively, a move back down under 1790.00 and the 50 SMA, would find supports at 1775.00 and 1751.00 as of June’s low. A loss of this level extends the control of sellers and opens the way to a test on 1700.00 and the lows at 1680.00/1668.00.

Mid Week Macro Report 18 August 2021
Treasury First – Mid Week Macro Report 18 August 2021
Markets are continuing to focus on the FED with each public engagement becoming a potential risk. Yesterday the FED Chair said that the FED was in the process of putting away its emergency tools used during the Covid crisis but held short of mentioning a taper. The equity markets in the US had been moving lower ahead of his speech but recovered when it was clear that he did not mention tapering. Today the focus will shift to the FOMC Meeting Minutes with traders shifting through the text to see if they can determine a tapering date. Rate hikes are still a long way off and the FED appears to be concerned with the approximately 7 million workers that have not yet returned to work. However, the rise of inflation is pressuring the FED into starting the tapering process, with an announcement in September likely.
NZDUSD
The NZDUSD FX pair is trading at 0.6927. Price is above its supporting 0.6870 area. The price tested resistance at the 0.7100 level in July creating a lower area of resistance and then sold off. The pair is consolidating since then with a downward bias. Price is using the 0.7000 area as resistance in the short term. A confirmed breakout above 0.7000 and the 50 SMA opens the way to resistance at the 0.7100/0.7130 area and the 100 SMA. The 0.7220 area provides a target along the way to the 0.7315 area. Alternatively, a move back down under 0.6870 and the 0.6900 zone open the way to support at 0.6800. The 0.6795 area support is followed by further supports at 0.6700 and 0.6683.
US 500 Index
The US 500 Index created a new high at 4485.00 on Monday and is now testing the 4450.00 area as resistance as price action remain bullish. If the market breaks above the resistance area, the way opens to 4500.00. The market backed off from the high yesterday and found support at the 4417.00 area. Price is attempting to build on support in this area followed by the 4400.00 area. A move higher from the current level, targets resistances at the 4600.00 area and 4672.00 level. Beyond this level, 4700.00 offers resistance as the extreme target. Alternatively, a move back below 4400.00 signals a test on the support at 50 SMA around 4368.00 The 4300.00 then becomes supportive followed by the 100 SMA around 4277.00. Below this level the 4250.00 area would be used as support along with the 4200.00 level. A run below this support would quickly target the 4060.00 followed by 4000.00/3990.00.

GBPJPY
The GBPJPY chart is showing how the pair has traded lower over recent days with price now trading at 150.655. The 151.332 level is expected to act as resistance in the short term. A break above this level would find resistance at the 50 SMA around 152.600 which has crossed below the 100SMA currently around 153.000 level. A continued move higher may find more resistance around the 153.400 level with a breakout leading to a targeting of the 156.116 area. Alternatively, a move back down under 150.000 and the 200 SMA, would find supports at 149.655 and 148.470 as last month’s low. A loss of this level extends the control of sellers and opens the way to a test on 147.000.
