
Month: September 2021
Treasury First – Mid Week Macro Report 29th September 2021
Treasury First – Mid Week Macro Report 29th September 2021
The markets are focussing on global bond markets and the rise in yields at present with equities declining and a general tone of risk aversion entering the space. The risk off tone is being particularly badly felt in the tech sector with a rotation out of tech and into value taking place in equities. This was very evident in the Nasdaq yesterday, which was the worst performing of the US stock markets. The Nasdaq felt this rotation and was compounded by its sensitivity to higher rates. Energy commodities softened a little after they rallied hard in recent days. However with fuel shortages in the UK and higher prices across the energy block, it is anticipated that prices will continue to rise into the winter. This is being coupled with supply and distribution disturbances across many sectors, further increasing prices and signalling continued rising inflation. The US Federal Reserve has signalled that it will taper asset purchases and the prospect of rate increases are already being discussed but in the context of the first rate hike taking place in 2023. Rampant rises in inflation may bring forward the timeline for hikes. As the end of the month/quarter approaches, traders, corporates and fund managers will be rebalancing their positions and this may result in some more unusual moves across markets. Volatility should increase over the next 2 days and create exaggerated moves, which in turn can bring good trading opportunities. Good luck out there.
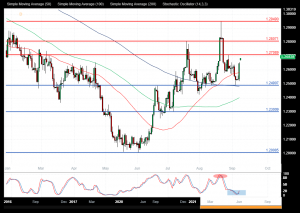
GBPUSD
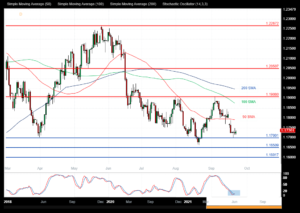
The GBPUSD FX pair is trading at 1.3520 after breaking below the 1.3600 level as support and testing lower to the 1.3500 area overnight. Price tested resistance at the 1.4250 area in June creating a double top. The pair is pushing lower this week after running into resistance around 1.3900 and consolidating. Price is using the 1.3700 area as resistance in the short term. A confirmed breakout above this level and the 50 SMA, opens the way to resistance at the 1.3850 area followed by 1.3900 as the 200 SMA followed by the 1.4000 area. Alternatively a move back down under 1.3500 opens the way to support at 1.3450. This area of support is followed by further supports at 1.3300 and 1.3185.

US 100 Index
The US 100 Index created a high at 15700.00 last month and is now testing the support area of the last higher low around 14800.00. The area of support is corresponding to the neckline for a head and shoulders pattern that has triggered with a loss of 14900.00. The pattern would become invalid with a move back above 15179.00 and a push over 15500.00. If the market breaks above the resistance area at 15416.00, the way opens back to the high at 15711.00. Further resistance comes onto the chart at 15900.00 ahead of 16000.00. Alternatively, a move back below 14750.00 signals a test on the support at 14450.00 The 14230.00 area then becomes supportive followed by the 14000.00 round number level. Below this level the 13965.00 area would be used as support along with 13480.00 as a significant higher low.

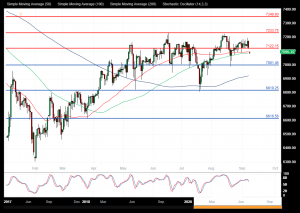
Crude Oil
The Crude Oil chart is showing how the price has moved back up to test the former high around 7650.00 after reaching a higher low at 6200.00 in August. With price now trading at 7375.00 as it resistance can be seen at 7500.00 and support at 7270.00. The 7600.00 area is expected to act as resistance in the short term as it relates to the July high. A break above this level would find resistance ahead of 7650.00 as that high. A continued move higher finds more resistance around the 7700.00 and 7760.00. A breakout from there opens the way to 7800.00. Alternatively a move back down under 7270.00 would find supports at 7040.00 and 7000.00. A loss of this level extends the control of sellers and opens the way to a test on 6730.00 area.

Treasury First – Mid Week Macro Report 22 September 2021
Treasury First – Mid Week Macro Report 22 September 2021
The Chinese Evergrande Group is continuing to dominate markets with the latest news that it will pay its interest coupons tomorrow that are maturing on its onshore bonds – nothing has been mentioned regarding the interest repayments on their off-shore bonds. The news has sparked another leg higher in the risk rally off of Monday’s low – particularly seen in global equities. However, the risks around the group are still elevated and there is some concern that foreign debt will not be serviced. The real concern is how the Chinese authorities will deal with this issue and if it can spill over into the wider Chinese property market and into global credit markets. The markets are being helped in their risk on approach today ahead of the other key event this week, the FOMC meeting – this evening at 7.00 pm London time. The FOMC is expected to leave its rates unchanged but may signal a more positive shift in economic sentiment and Covid-19 cases as setting up the market for a taper of asset purchases. An official announcement of this is not expected until November at the earliest but the market will look for hints that a taper is on the cards in order to position for such an event. The other interesting element of tonight’s meeting will be the release of the new economic projections from the committee members, taking in 2024. The thing to watch here is the ‘’dot plot’’ – the projections of each member of the committee on the interest rate hiking cycle. All eyes on whether enough members see a lift-off to interest rates by the end of 2022 – this would be interpreted as hawkish by the markets. At present, the market is relatively calm with an upside bias. In the FX space, the volatility in recent days has subsided to some degree and markets are awaiting developments from the FOMC.
EURUSD
The EURUSD FX pair is trading at 1.1730 after breaking below the 50 SMA as support and testing lower to the 1.1700 area on Monday. Price tested resistance at the 1.1750 level in July creating a lower area of support and this is being tested as near term resistance. The pair is consolidating around 1.1800 running into resistance around 1.1900 and support around 1.1700/1.1650. Price is using the 50 SMA area as resistance in the short term at 1.1800. A confirmed breakout above this level and the 100 SMA, opens the way to resistance at the 1.1875 area followed by 1.1900. The 1.1950 area may then be resistive as the 200 SMA followed by the 1.2000 area. Alternatively, a move back down under 1.1700 opens the way to support at 1.1650. This area of support is followed by further supports at 1.1600 and 1.1570.
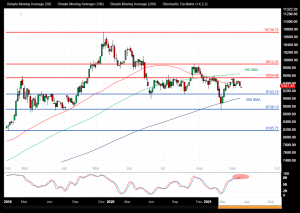
Wall St 30 Index
The Wall St 30 Index created a high at 35640.00 last month and is now testing the support area of the last higher low around 33750.00 after breaking the rising trend line at 34900.00 area earlier this month. The price tried to hold onto the 100 SMA last week but support gave way at 34500.00. If the market breaks above the resistance area at 34200.00, the way opens back to 3450.00. Further resistance comes onto the chart at 34800.00 and 35000.00. Alternatively, a move back below 34000.00 signals a test on the support at 33800.00 The 33600.00 area then becomes supportive followed by the 33000.00 round number level. Below this level, the 32566.00 area would be used as support along with 32030.00 as a significantly higher low.

Gold
The Gold chart is showing how the pair has consolidated over recent weeks after reaching a lower high at 1916.00 in June and finding support at 1667.00 in August. With price now trading at 1775.00 as it consolidates after bouncing from support at 1741.60. The 1800.00 area is expected to act as resistance in the short term as it contains the moving averages. A break above this level would find resistance ahead of 1835.00. A continued move higher finds more resistance around 1865.00 and 1877.00. A breakout from there opens the way to 1900.00 and 1916.00. Alternatively, a move back down under 1741.00 would find support at 1700.00 and 1667.00 as the August low. A loss of this level extends the control of sellers and opens the way to a test on the 1600.00 area.

Mid Week Macro Report 15 September 2021
Treasury First – Mid Week Macro Report 15 September 2021
Growing worries surrounding the cash strapped Chinese Evergrande property group is rippling across markets with the groups May 2023 bonds halted for trade after falling more than 20% overnight.
Chinese authorities stated overnight that the group would not be in a position to pay interest due on 20th September. The group has been scrambling to raise the funds it needs to pay suppliers and lenders. Risks are rising of a default linked to the bank such as smaller Chinese financial institutions and the wider Chinese property market. The groups share price fell to a six year low yesterday amid wild swings in price. The group has over $305B in liabilities with no material progress made in its attempt to sell off assets, as fears intensify that it will be unable to repay investors. Markets are riding waves of risk at present as central banks look to taper their Covid emergency purchases programmes. Economic data is presenting mixed signals and Covid is waxing and waning in various locations. All in all the seasonal weakness in asset prices in dragging prices lower as the risk off sentiment takes hold with Quadruple witching taking place in the equity markets later this week – Quadruple witching refers to four days during the calendar year when the contracts on four different kinds of financial assets expire. The assets on which the contracts expire on that day are stock options, single stock futures, stock index futures and stock index options. These expiries days can bring with them added volatility in the stock markets.
The above is all in the backdrop of weaker US stocks markets over the past week. The price action in stocks was very telling yesterday, as they failed to rally on the back of a weaker CPI figure out of the US. In the past this would have been positive for stocks, as with low inflation the global Central Banks are in no rush to taper or raise interest rates and the monetary stimulus continues. Stock markets should be monitored closely over the remaining trading sessions this week, as they dictate the market’s sentiment and moves in other asset classes.
AUDUSD
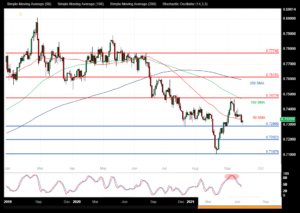
The AUDUSD FX pair is trading at 0.7325 after testing the 50 SMA as support and breaking lower yesterday to 0.7300. Price tested resistance at the 0.7775 level in July creating a lower area of resistance and then sold off to the 0.7108 support zone in August. The pair is trending higher since then but us running into moving average resistance. Price is using the 0.7477 area as resistance in the short term. A confirmed breakout above this level and the 100 SMA, opens the way to resistance at the 0.7500 area followed by 0.7600. The 0.7615 area may then be resistive followed by the 0.7700 area. Alternatively a move back down under 0.7300 opens the way to support at 0.7200. This area of support is followed by further supports at 0.7130 and 0.7100.
US 500 Index
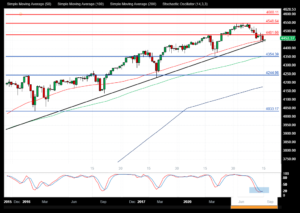
The US 500 Index created a high at 4549.00 at the start of the month and is now testing the 50 SMA and the rising trend line at 4450.00 area as the price action remains bullish. If the market breaks above the resistance area at 4500.00, the way opens back to 4550.00. Further resistance comes onto the chart at 4573.00 and 4600.00. The market is creating higher highs and higher lows using the support of the trend line. Alternatively, a move back below 4450.00 signals a test on the support at 4430.00 The 4400.00 area then becomes supportive followed by 4354.00 and the 100 SMA. Below this level the 4245.00 area would be used as support along with 4230.00 as a significant higher low.
EURCAD
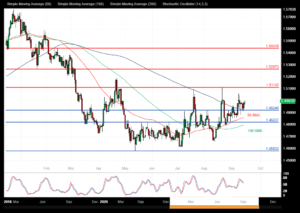
The EURCAD chart is showing how the pair has consolidated over recent weeks after reaching a lower high at 1.5200 in April and finding support at 1.4580 in May. With price now trading at 1.5000 as it consolidates after bouncing from support at 1.4600. The 1.5100 area is expected to act as resistance in the short term. A break above this level would find resistance ahead of 1.5200. A continued move higher finds more resistance around the 1.5267 and 1.5300. A breakout from there opens the way to 1.5442 and 1.5600. Alternatively a move back down under 1.4924 would find supports at 1.4824 and 1.4660 as the August low. A loss of this level extends the control of sellers and opens the way to a test on 1.4600 area.
Mid Week Macro Report 8th September 2021
Treasury First– Mid Week Macro Report 8th September 2021
The financial markets experience a ‘’risk off’’ move yesterday after US markets returned from the Labour Day holiday. This risk off move has extended into the opening of the European session on Wednesday with a fall in risk assets such as stocks and crypto currencies. Following on from the US Non-Farm Payrolls report last week, the initial reaction in markets centred on the prospect of a delay to the FED’s taper of asset purchases. However, as time has progressed the market has become more bearish, with the narrative now shifting towards a broader global slow down. These markets have the ability to shift their macro outlook in a matter of days. What has added additional woes this morning is FED member Bullard’s interview with the Financial Times. He still argues that the FED should taper sooner rather than later. He said that he was looking for job gains to average out around 500k per month this year. He said that the jobs numbers are going to bounce up and down, adding that the jobs are there, but workers may not want the jobs right now. He said that the FED needs to have the option to raise rates in 2022. He said that in order to achieve this, the FED needs to wrap up asset purchases by the end of Q1 2022. He added that another reason to taper is the incipient housing market bubble. More FED speakers are scheduled to engage with the press this week and it will be interesting to see if their pre-Jackson Hole hawkish stance remains in tactic given Powell’s speech and the lower than expected NFP figure last Friday.
One has to argue that last week’s weak employment figures out of the US have produced some strange reactions in financial markets – the back end of the US curve has rallied, stocks have sold off and the Dollar has moved higher versus EM and G10 currencies. A sustained move in any direction, in any asset classes, bar US stock markets has been hard to come by this summer, so we wait in anticipation to see if this move has legs. Of course, all eyes turn to next week and the CPI figures out of the US – potentially giving us an insight into whether inflation is transitory or not…..
USDCAD
The USDCAD FX pair is trading at 1.2680 after testing the 50 SMA as resistance and breaking higher yesterday. The price tested resistance at the 1.2800 level in July creating a lower area of resistance and then sold off to the 1.2430 support zone. The pair is trending higher since establishing the 1.2000 area as support in June. Price is using the 1.2700 area as resistance in the short term. A confirmed breakout above this level opens the way to resistance at the 1.2800 area followed by 1.2820. The 1.2900 area may then be resistive followed by the highs above 1.2950. Alternatively, a move back down under 1.2600 opens the way to support at 1.2500. This area of support is followed by further supports at 1.2490 and 1.2300.
UK 100 Index
The UK 100 Index created a lower high at 7233.00 in June and is now testing the 7080.00 area as the price action remains bullish. If the market breaks above the resistance area at 7122.00, the way opens to 7200.00. Further resistance comes onto the chart at 7250.00 and 7350.00. The market is creating higher highs and higher lows using the support at 7000.00. Alternatively, a move back below 7000.00 signals a test on the support at 6920.00 The 6800.00 area then becomes supportive followed by 6700.00. Below this level, the 6616.00 area would be used as support as a significantly higher low.
Copper
The Copper chart is showing how the industrial metal has traded lower over recent weeks after reaching a high at 10730.00 in May. With price now trading at 9300.00 as it consolidates after bouncing from support at 8740.00. The 9425.00 level is expected to act as resistance in the short term. A break above this level would find resistance at the 50 SMA around 9450.00. A continued move higher finds more resistance around the 9554.00 and the 100 SMA around 9650.00. A breakout from there opens the way to 9920.00 and 10000.00. Alternatively, a move back down under 9130.00 would find support at 8740.00 as the August low. A loss of this level extends the control of sellers and opens the way to a test on 8185.00 and the 8000.00 area.
Mid Week Macro Report – 1st September 2021
Treasury First – Mid Week Macro Report 01 September 2021
The Jackson Hole symposium last week created headlines in the markets with a slew of hawkish FED members prepping market participants before FED Chair Powell spoke on Friday. The difference in tone between the FED Chair and his hawkish colleagues was enough to dampen any market fears of a taper tantrum (reducing QE). Powell gave a master class in walking a fine line between introducing the need for a taper and downplaying the risks to the market of elevated asset prices. He used the Covid-19 virus as a reason to delay making a decision on tapering in the immediate future. He also raises the bar for the start of rate hikes, by assuring the market that any signs of tapering of QE does not at all indicate a potential start of rate hikes any time soon. Yesterday it was the turn of the ECB to suggest tapering asset purchases with policymakers highlighting the rise in inflation and the much improved economic landscape. We had Lane last week, followed by two members of the ECB this week both noting higher inflation in the Eurozone and the need to address the issue. The PEPP facility would be centre stage in line for a taper, with the programme set to expire in March. Again the ECB wants to disconnect asset purchase programmes from the rate hike cycle. Equity markets sold off on the ECB comments but they have stabilized overnight. We also saw a sharp selloff in European Govt bond markets, led by Italy on these ECB comments, sending yields higher over the course of the week and in turn EUR/USD.
This week’s major risk event will be US Non-Farm Payrolls report on Friday. In many respects, this is a bigger market event than Jackson Hole and should bring with it huge volatility on Friday. As mentioned above the messages from the Fed have been mixed – with Chair Powell on one side of the spectrum and the hawks on the other. Friday’s employment report will give either side further ammunition for their central argument and should dictate the direction of markets into the final quarter of the year. A strong figure on Friday – above 725k and an unemployment rate below 5.2% would see the hawks strengthen their case – the Fed meeting at the end of Sept would come into play. On the back of this stock markets should sell off, US yields would rally, along with the Dollar, and Gold should sell off. However, anything disappointing – below 725k and above 5.2% would see the complete opposite, with stocks markets continuing their powerful move higher. We cannot over emphasise the importance of this event and the large market moves that it will bring tomorrow.
GBPUSD
The GBPUSD FX pair is trading at 1.3753 after testing the 50 SMA as resistance yesterday. Price tested resistance at the 1.3980 level in July creating a lower area of resistance and then sold off to the 1.3600 support zone. The pair is trending since establishing the 1.4250 area as resistance in June. Price is using the 1.3800 area as resistance in the short term. A confirmed breakout above this level and the 50 SMA opens the way to resistance at the 1.3900 area followed by 1.3980/1.4000. The 1.4085 area may then be resistive followed by the highs above 1.4200. Alternatively, a move back down under 1.3700 opens the way to support at 1.3600. This area of support is followed by further supports at 1.3560 and 1.3425.

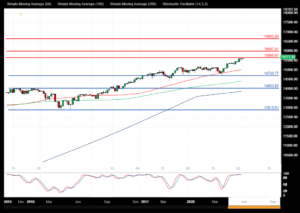
NAS 100 Index
The NAS 100 Index created a new high at 15697.00 yesterday and is now testing the 15600.00 area, however, the price action remains overall bullish. If the market breaks above the resistance area, the way opens to 16000.00 level into year end. Further resistance comes onto the chart at 16600.00 and 17000.00. The market is creating higher highs and higher lows using the support at 14720.00. Alternatively, a move back below 15000.00/14720.00 signals a test on the support at 14000.00 The 13860.00 area then becomes supportive followed by 13500.00. Below this level, the 12910.00 area would be used as support as a significantly higher low.
Silver
The Silver chart is showing how the precious metal has traded lower over recent weeks with the price now trading at 2382.00 as it consolidates after bouncing from support at 2211.00. The 2425.00 level is expected to act as resistance in the short term. A break above this level would find resistance at the 50 SMA around 2475.00. A continued move higher finds more resistance around the 2600.00 as the 100 SMA crosses down under the 200 SMA. Alternatively, a move back down under 2290.00 would find support at 2211.00 as August’s low. A loss of this level extends the control of sellers and opens the way to a test on 2170.00 and the 2122.00 area.
