Category: Market Update
Week Ahead 26th Feb-1st March 2024
The Week Ahead –
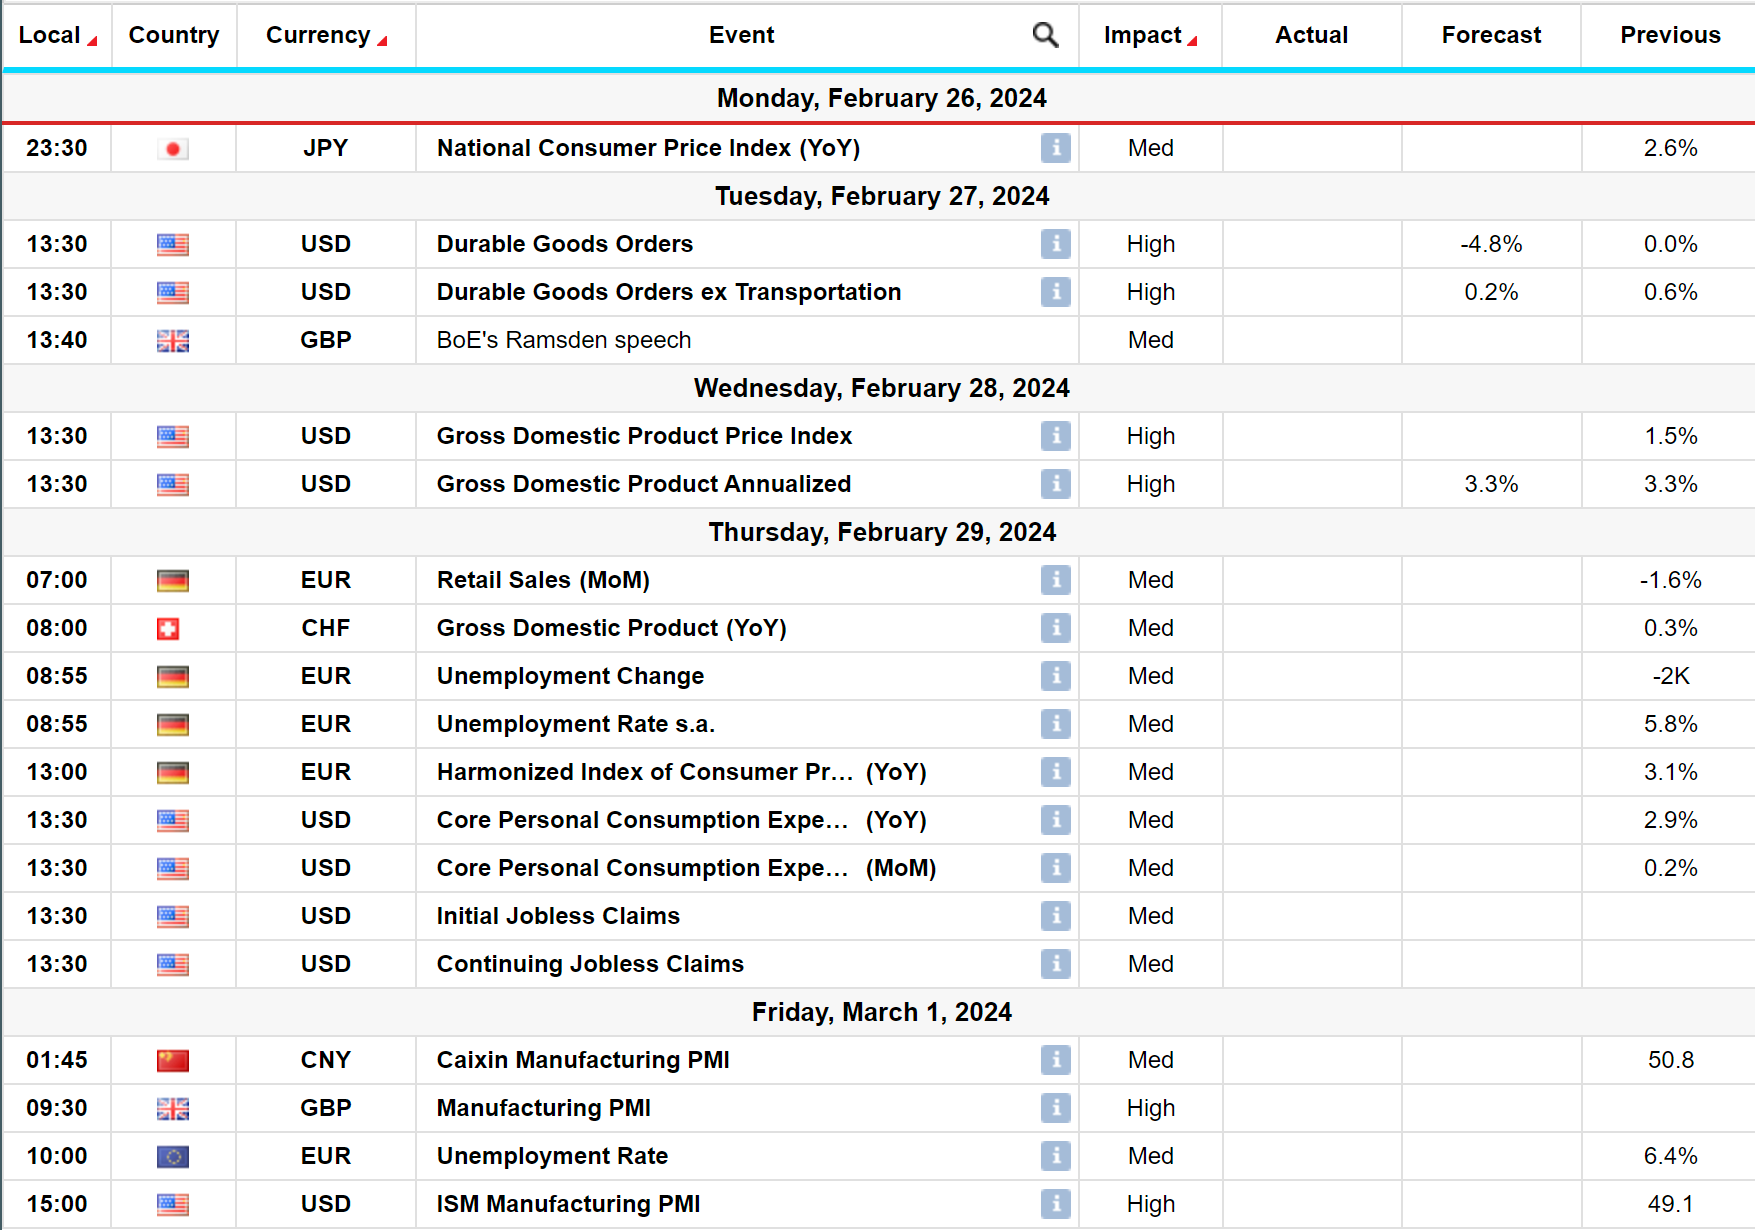
Economic Table
What’s Going On?
As highlighted throughout our reports so far this year the currency markets have been stuck in tight ranges, with the dominant theme being Dollar strength – which is in complete contrast to the end of 2023, when the Dollar was on the back foot. The root cause of this Dollar strength and lacklustre FX markets boils down to global central banks and the timing of interest rate cuts. The financial markets had nailed their colours to the mast in the final quarter of 2023, calling for a deterioration of US economic data and an interest rate cut by the Federal Reserve by March of 2024. Hence the market has positioned itself for a weaker Dollar, which saw the likes of EUR/USD and GBP/USD rally into year end. The market got this spectacularly wrong – US economic data has outperformed its peers since Jan 1st and the Federal Reserve in the US has categorically stated that they are not going to cut interest rates in March. This has led to a liquidation of positions build up into the end of 2023 and a complete reversal of the weaker Dollar trend in the currency markets.
It’s always a dangerous game when the financial market attempt to accurately predict the precise timing of interest rate cuts by central banks and it can lead to choppy, directionless markets in the lead up to it – unfortunately that is what we are now experiencing in the FX markets – with a bias of overall Dollar strength.
The other theme that has emerged this year so far is Sterling strength, particularly in the Sterling crosses – with the likes of GBP/EUR, GPB/CHF and GBP/JPY all trading towards the top of their 18 month range. GBP/EUR needs to break the 1.1765 or in EUR/GBP terms the 0.8500 level to garner further momentum for the Pound.
Levels in G10 to watch this week –
EUR/USD – 1.0900 remains the elusive topside level in EUR/USD – 1.0898 the high so far this month – back below 1.0750 and we should see further Euro weakness, Dollar strength.
EUR/GBP – It’s all about the 0.8500 support level in EUR/GBP – a break of here and we will see fresh 18 month lows and further Sterling strength. Back above 0.8650 and something significant has changed in these markets.
GBP/USD – Whilst the Pound has done well versus the majority of G10 currencies this year, it still struggles against the Dollar. 1.2800 is the topside level to break, which could see GBP/USD run towards 1.3000 level. Back below 1.2560-50 zone and we would begin to get worried regarding the Pound.
Week Ahead –
It’s a quiet start to the week; however things get a little busier in the latter half, which could bring some excitement to the currency markets.
The week kicks off on Wednesday with the Reserve Bank of New Zealand’s interest rate decision. We expect the RBNZ to leave rates on hold at 5.5% at its February 28th meeting even though the labour market data were stronger than expected. It has been on hold since it last hiked in May last year.
On Thursday/Friday we get Eurozone inflation figures – The Eurozone February flash inflation round begins with France, Spain and Germany. The Eurozone-wide estimate is released at 1000GMT/1100CET on Friday, with an early consensus looking for core inflation at 2.9% Y/Y (vs 3.3% prior) and headline at 2.5% Y/Y (vs 2.8% prior)
Again on Thursday we get the January PCE deflator from the US. This will be the last reading of the Fed’s preferred inflation gauge before its March interest rate decision meeting, so it will be eagerly watched by the markets.
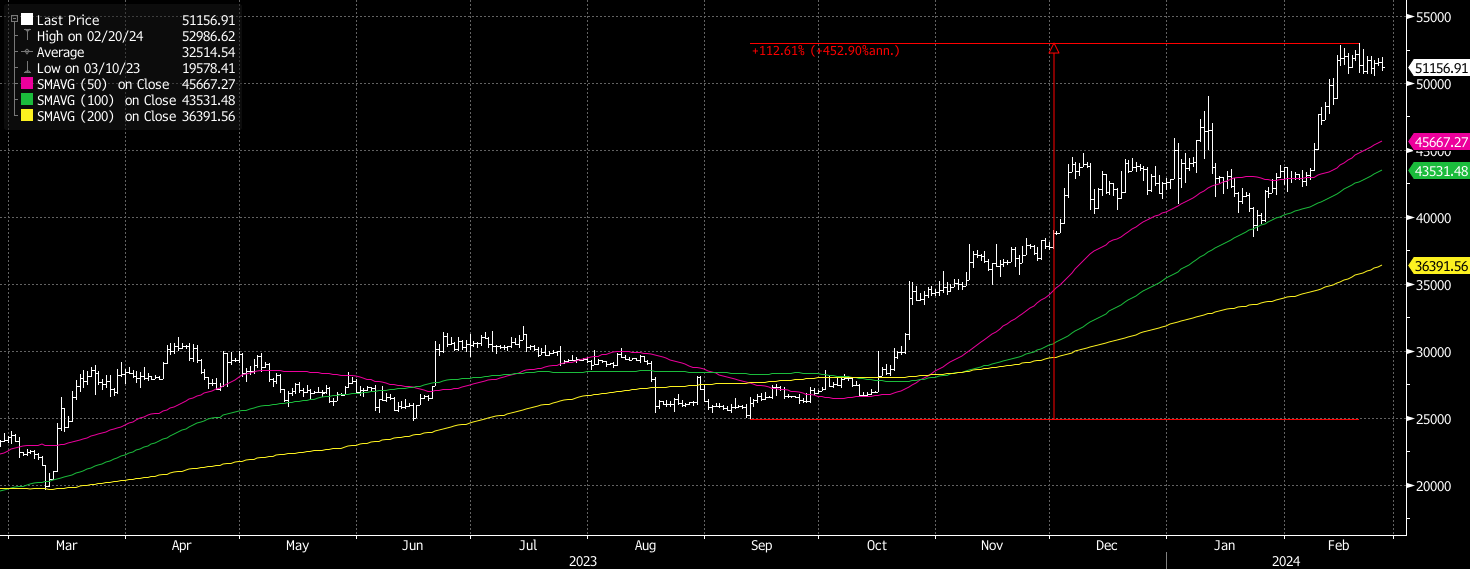
Chart of the Day – Bitcoin – it’s worth highlighting that the Dollar is not strengthening against everything – with Bitcoin rallying over 112% since Oct of last year – see chart below.
GBP – UK Economic Data – A focus on Sterling – GBP/USD and EUR/GBP
A focus on Sterling – GBP/USD and EUR/GBP
What’s going on in the FX markets?
The currency markets remain in a tricky environment, as we move from one risk event to the next, desperately trying to find some insight and direction. We highlighted at the beginning of the year that the financial markets were putting themselves in a dangerous position, as they attempted to predict the timing of the first interest rate cuts by the major global central banks. The financial markets had the first interest rate cut priced in by the US Federal Reserve for March of this year and had positioned themselves in the currency markets and Fix Income markets accordingly. The markets have got this spectacularly wrong and it now looks more likely to be May if at all then. This has led to choppy, directionless markets, with the Dollar experiencing large periods of strength – very much against what the markets were looking for going into this year.
Despite the dominance of the Dollar so far this year, GBP/USD has held up relatively well towards the upper half of its previous 12 month range. Sterling crosses – so the likes of GBP/EUR, GBP/CHF, GBP/JPY have all fared very well so far this year, with GBP/EUR up towards the upper end of its 18 month range.
Last week’s slew of UK economic data was meant to set the scene for a higher Pound across the board, however it ended up painting a very mixed picture of the economy, with both the inflation and GDP figures coming in weak and activity data registering beats. Looking through it all though, the data suggested that the macro backdrop is evolving quite well for the UK and the markets are looking for the first interest cut in the UK in August now. This would mean that the UK would be one of the last G10 central banks to cut interest rates.
With this in mind, the Pound should fare well against its G10 counterparts and we do feel GBP/USD will perform well in the coming weeks.
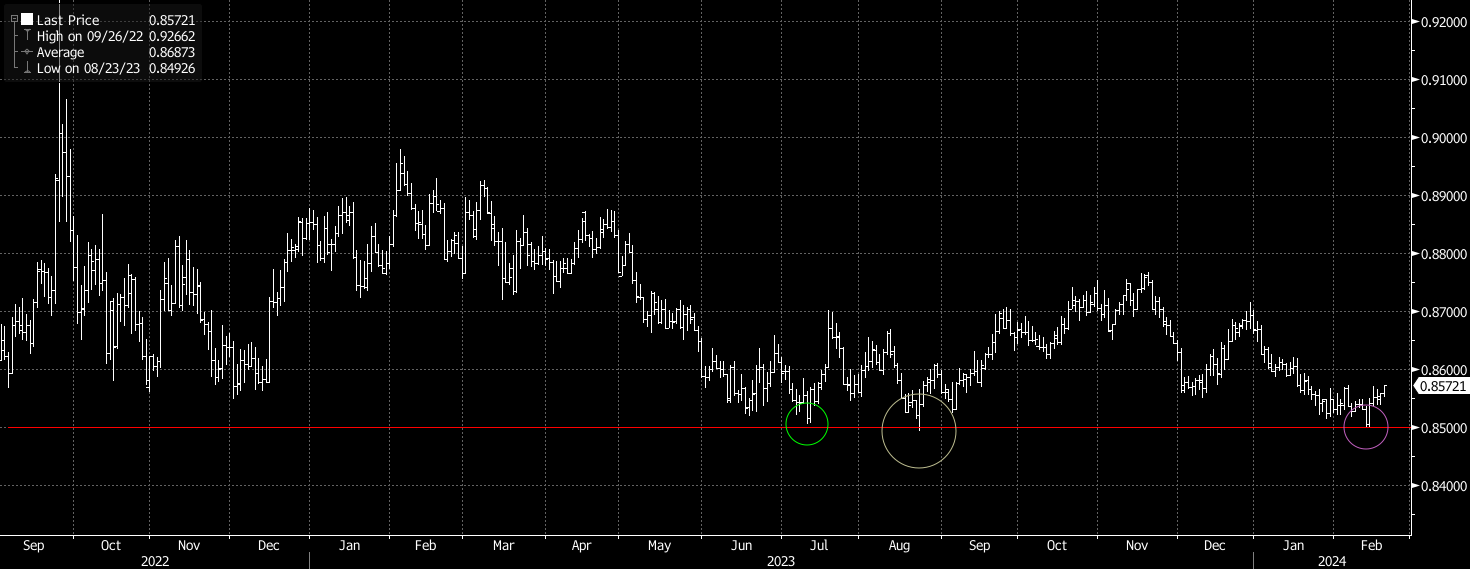
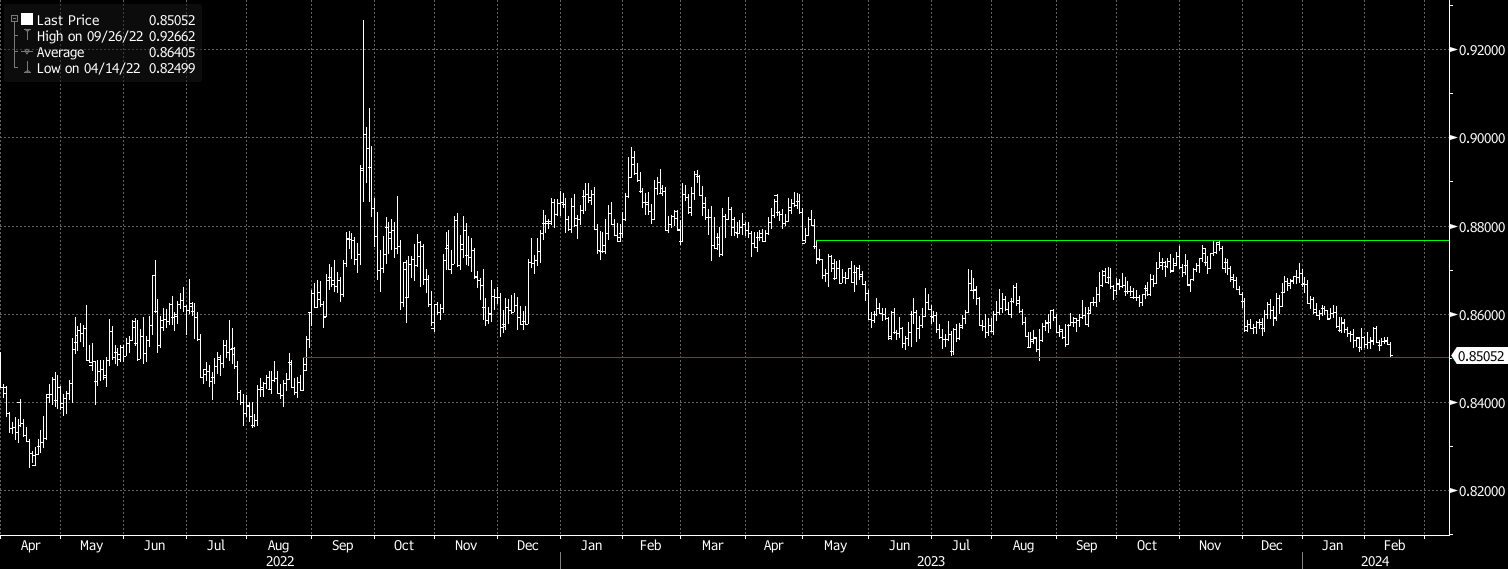
EUR/GBP has one again bounced off this huge support at 0.8500 and cannot seem to muster up enough momentum to break through this line and continue its trend lower – see chart below –
Chart of the Day – EUR/GBP – 0.8500 remains the 18 month low in EUR/GPB – see red line on chart – we have failed to break and close below this line and have subsequently bounced back above 0.8550 this week.
RISK EVENT – US Inflation Data – 13th Feb 2024
RISK EVENT – US Inflation Data – 13th Feb 2024
Event – US Inflation Data
Time – 1.30pm London time
Economist’s Expectations –
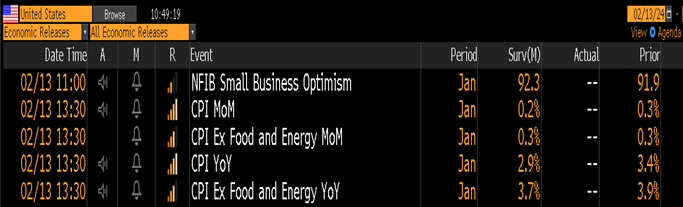
Importance – Very High
Implied Volatility – High
Certainty surrounding the economic release – Moderate
What’s going on?
UK and Sterling – In what has to be classified as very dull currency markets, Sterling is standing out amongst its peers. As highlighted last week, we get a series of UK economic data releases over the course of the next few days which should provide us with a real insight into the direction of play for both EUR/GBP and GBP/USD. The first of these data points were released this morning with the UK Employment Report. The UK Jobs Report come in much better that expected across the board – beating market expectations on all accounts. This saw the Pound rally versus G10 currencies – with GBP/JPY now at fresh post Brexit highs, GBP/CHF extending aggressively past 1.1060 and it feels like a matter of time before EURGBP breaks below the all-important support at 0.8510-00. Tomorrow we get the UK’s inflation report and Thursday we get the GDP release. Further strong outcomes here and the Pound should outperform – particularly versus the Euro and CHF. Weather we can push higher versus the Dollar will of course depend on this afternoon’s US Inflation report.
What the markets are looking for today – US Inflation data
The US Inflation Report today comes after the significant trimming of Federal Reserve interest rate cut expectations in the markets following the bumper payrolls report on Feb 2nd and a succession of Fed members calling for patience from the markets regarding interest rate cuts. Consensus sees core CPI print another 0.3% M/M in January and Friday’s seasonal revisions shouldn’t have materially swayed these estimates. Core CPI was revised down from 0.31 to 0.28% M/M in Dec but with the three-month average unchanged at 3.3% annualized. Core services were revised lower meanwhile, including the “supercore” down from 4.3% to 4.0% annualized over three months. It still sees a large wedge to the PCE supercore though, tracking 2.2% annualized in December (prior to revisions). As such, specific CPI implications for PCE are again likely to help set the tone for market reaction.
Outcomes –
This afternoon’s data release will be pretty binary when it comes to the Dollar and where EUR/USD and GBP/USD finish the day. A strong inflation figure and the Dollar rallies versus G10, a weaker one and we sell off. It does feel however that the currency markets will be impacted more significantly on a weaker figure = lower Dollar.
EUR/GBP – The cross sits right on major support post better than expected UK Jobs Report this morning – red line on chart. We have not been below this support for 18 months – a break and weekly close below would be very significant.
Daily FX Bites 15th November 2023
Welcome to our daily morning FX Bites email. A 30 second snap shot of the key economic releases and risk events that lie ahead from across the global. We have kept it concise and clear; however containing all the information you need to ensure you are up –to-date with the latest market moving events in the world of foreign exchange – from economic data releases to the latest central bank speakers.
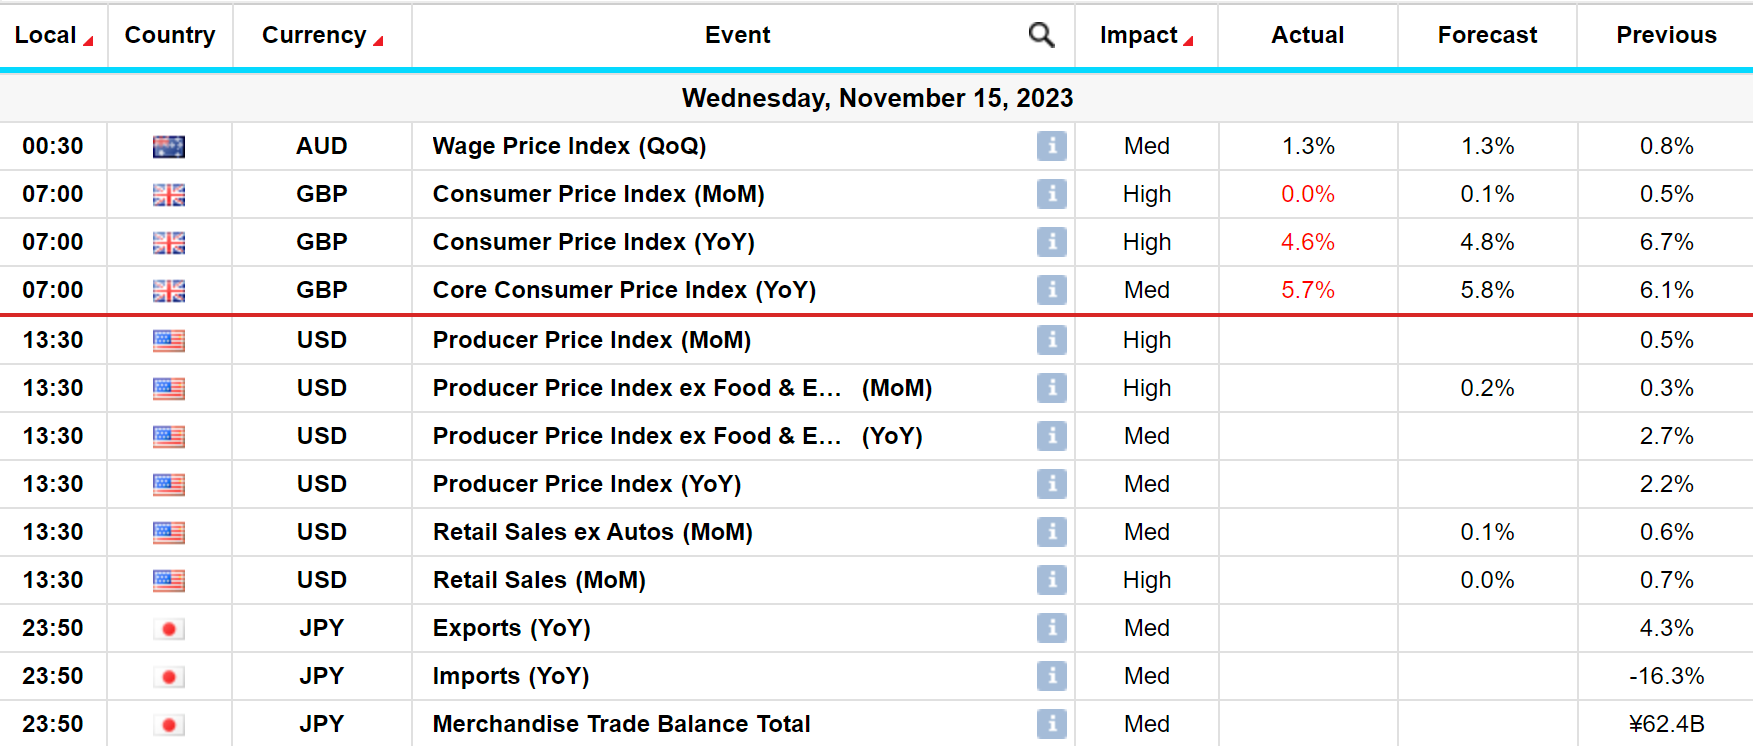
Economic Table
The FX markets woke up yesterday…….
Plenty to get our teeth into this morning in the foreign exchange markets, following 4-6 weeks of pretty dull ranges it has to be said. As highlighted yesterday in our ‘’Risk Report’’ the US Inflation Report proved very meaningful indeed and had a huge impact on the FX markets. The inflation figure in the US came in slightly weaker than expected, with the month on month figure coming in at 0.0% versus market expectations of 0.1% – a small miss, however a meaningful one nonetheless. Essentially this dip in US inflation has greatly reduced the probability of a further interest rate hike in the US in Dec and has subsequently led to a weaker Dollar across the board. The likes of EUR/USD, GBP/USD and AUD/USD have broken some significant levels now on the topside, taking us out of our recent ranges and we await and see if these moves are sustainable into the weekend and beyond.
This morning we had Industrial Production and Retail Sales out of China – both coming in slightly above expectations, which of course is a positive sign for the overall global economy.
We also had inflation figures out of the UK this morning – again, like we are seeing globally – they came in below the market’s consensus – this has been seen as an overall positive for the UK economy and Sterling has managed to hold onto most of its gains, particularly versus the Dollar, from yesterday.
Day’s Highlights –
At ‘’ High’’ on the importance scale this afternoon we have – Retail Sales out of the US – the market is looking for a weaker figure here, which of course will help compound yesterday’s weak inflation report
At ‘’ High’’ on the importance scale this afternoon we have – PPI out the US also – again a slightly weaker figure here month on month is expected – if this is the case again it will highlight the softening US economy.
Major levels to keep an eye on this week –
EUR/USD – EUR/USD broke the all-important 1.08 resistance level yesterday afternoon, trading to a high of 1.0888 overnight. We now look to see how it trades over the coming sessions and whether we see a mean reversion or not – ideally if this uptrend in EUR/USD is to continue, the old resistance at 1.08/turned new support should hold and the market should buy EUR/USD into this zone.
GBP/USD – As was the case with EUR/USD yesterday afternoon, GBP/USD broke through firm resistance at 1.2440 – a level which had capped us since early Sept, trading to a high of 1.2506 this morning. Again this 1.2440 level should attract further buyers who had missed the initial rally yesterday.
EUR/GBP – Given this is a Dollar move – EUR/GBP is somewhat side lined during these moves – it does remain however on a 0.87 handle and until we can break back below 0.8650 – the danger remains to the topside
Chart of the Day – EUR/USD
A chart of EUR/USD from July of this year. EUR/USD sold off some 7.50% from July of this year to early Oct. Since the lows in Oct we have seen a 4.20% rally and as mentioned above we took out the 1.08 level yesterday afternoon – convergence of yellow and green line on the chart below. If we retest and hold this 1.08 level, the probability for a move towards 1.10 over the coming weeks is hugely increased.

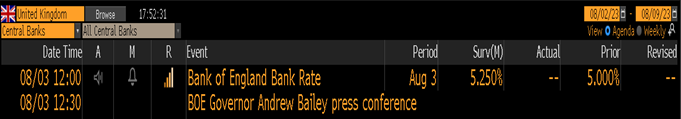
Bank of England Interest Rate Decision – 3rd March 2023
|

Daily FX Bites 26th July 2023
Daily FX Bites 26th July 2023
Welcome to our daily morning FX Bites email. A 30 second snap shot of the key economic releases and risk events that lie ahead from across the global. We have kept it concise and clear; however containing all the information you need to ensure you are up –to-date with the latest market moving events in the world of foreign exchange – from economic data releases to the latest central bank speakers.
What’s Going On?
On Monday we saw a slew of global PMI’s released out of Asia, Europe, the UK and the US for July – giving us the most up-to-date activity data on the global economy. The PMI economic monthly data releases give us a very good insight into the health of the global economies, in both the services and manufacturing sectors – above the 50 level for a PMI release means that the economy is doing well and expanding, below 50 and things are not looking that good. For the UK, the US and Europe yesterday, we did not get one PMI, neither in Services or Manufacturing above the 50 level for July……..!!. Relatively speaking the PMI’s in the US were stronger than the UK and Europe, with Europe printing the weakest amongst its peers. Hence we have seen EUR/USD trade below major support at 1.11/1.1090 yesterday and GBP/USD sell off however to a lesser extent.
Yesterday morning we have had German IFO Business Confidence Index released – coming in at 87.3 versus market expectations of 88.0. Again this has helped compound the PMI figures out of Europe on Monday and has seen further selling pressure in the Euro.
In contrast to this we had Consumer Confidence out of the US yesterday afternoon – market expectations had this release at 112.00, however it came out at a massive 117.00 – once again highlighting the recent dichotomy between Europe and the US.
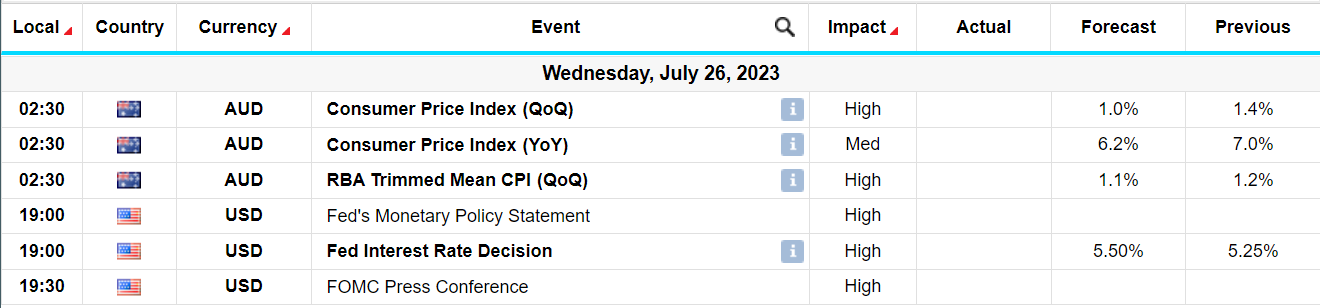
At ‘’ V High’’ on the importance scale we have – The Federal Reserve Interest Rate Decision at 7.00pm London time – Our base case however is that the Fed will hike by 0.25% to 5.50% and maintain its tightening bias at the July meeting. Chair Powell is likely to suggest that a follow-up hike is possible at the next meeting in September, but will emphasize that no decision has yet been made, and will depend on the substantial inflation and jobs data in the interim period. The market impact of this messaging is likely to be modestly hawkish.
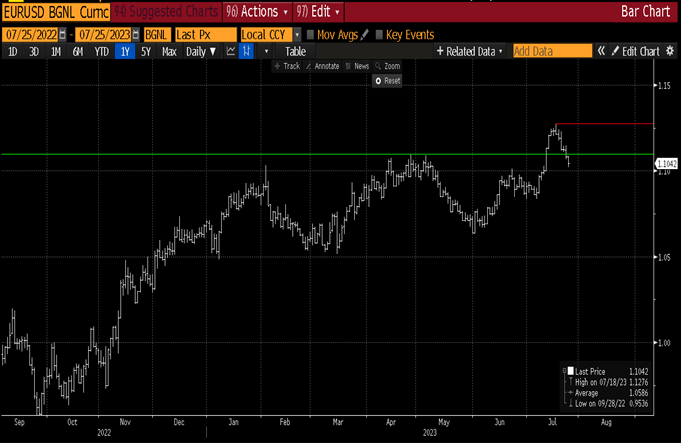
Chart of the Day
EUR/USD has sold off its highs from Monday of last week, which saw it trade above 1.1250 level – red line on chart. We have subsequently seen a slight reversal in the Dollar’s fortunes, as it has strengthened across the board. This has been further compounded versus the Euro on the back of much weaker PMI’s out of Europe on Monday, a weak IFO number of out Germany yesterday and a technical break of major support at 1.11/1.1090 – see green line on chart.
Daily FX Bites 20th July 2023
Welcome to our daily morning FX Bites email. A 30 second snap shot of the key economic releases and risk events that lie ahead from across the global markets. We have kept it concise and clear; however containing all the information you need to ensure you are up –to-date with the latest market moving events in the world of foreign exchange – from economic data releases to the latest central bank speakers.
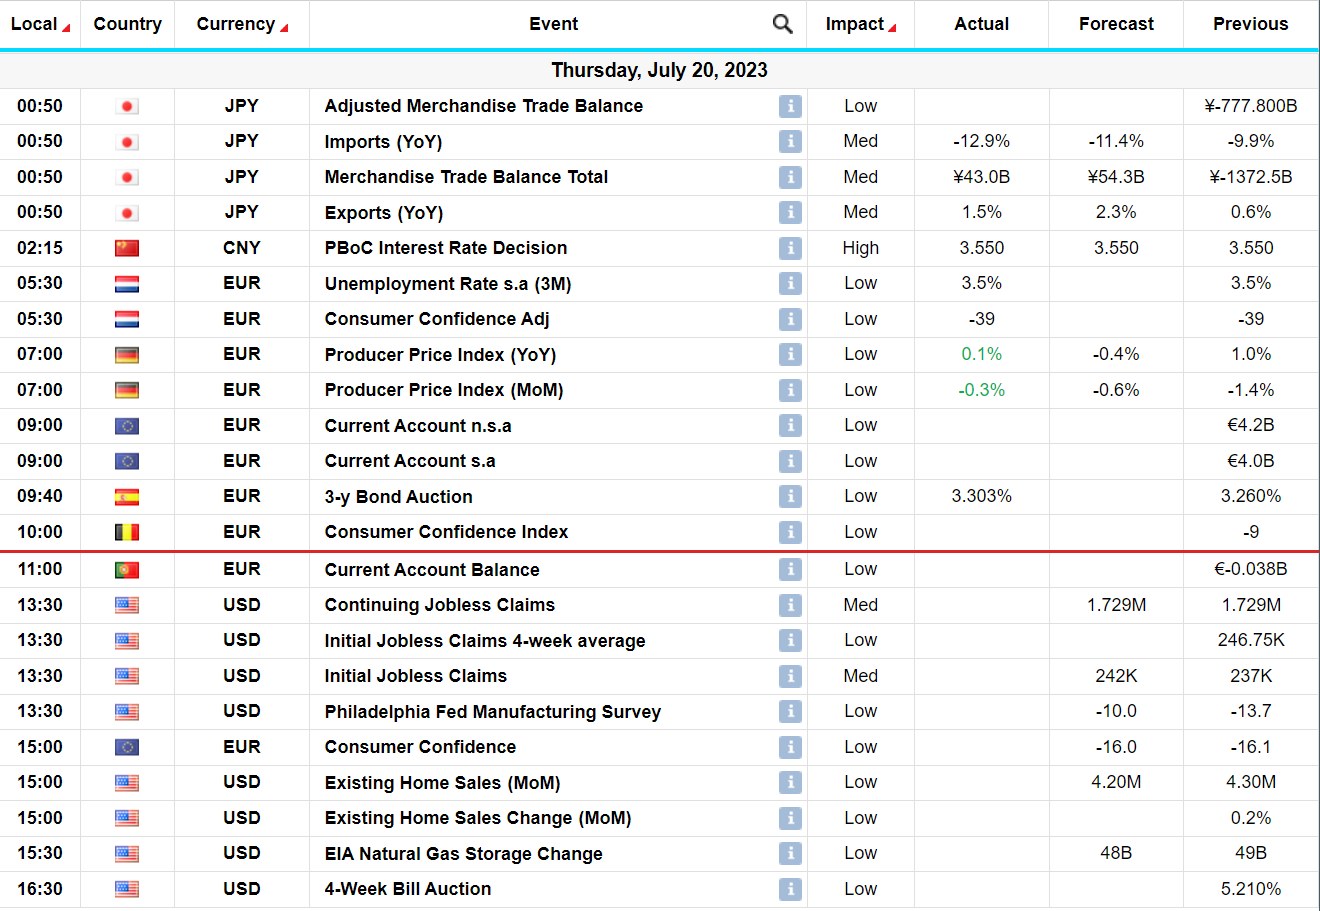
Today’s Highlights – A quiet session overnight in Asia, with little movement in the currency space. The Australian Dollar is the only outlier, rallying back above 0.68 versus the Dollar on the back of a much stronger Jobs Report out overnight – Employment Change came in at 32.6k in June, versus market expectations of 15k and the unemployment rate come in at 3.5% versus 3.6% expected in Australia.
We have no economic releases of significance out of Europe or the UK today.
At ‘’ High’’ on the importance scale we have – Existing Home Sales (low impact but is still an important figure to watch) and Initial Jobless Claims out of the US later this afternoon. Housing Starts came in slightly weaker than expected yesterday, adding to the mounting worries over a ‘’softer landing’’ in the US. Existing Home Sales will be closely watched this afternoon to see if this trend continues. Jobless Claims in the US have had significant market impact over the past number of weeks, as the market worries about a softening labour market – helping to compound this recent sell off in the Dollar- again this will be keenly watched this afternoon.
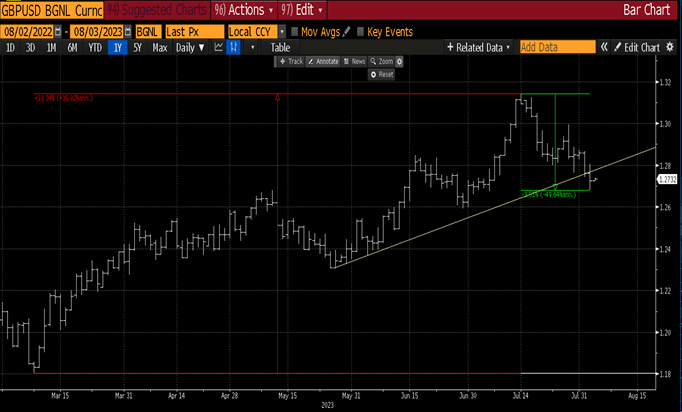
Chart of the Day – GBP/USD has rallied significantly over the course of June and July – over 6% since the beginning of June – see chart below. We topped out just above 1.3140 late last week and we have subsequently seen a 2% sell off. The market is still very much in a sell Dollars mode and will look to add to Dollar shorts on any rallies in the greenback. In saying that GBP/USD needs to close the week back above 1.30 – green line on chart – if we are to see further topside momentum in the Pound versus the Dollar.

The US Dollar – An Insight – Bigger Picture
The US Dollar – An Insight – Bigger Picture
The Dollar – Versus the Euro
It’s a 6 minute read –
Understanding our clients exposure to EUR/USD annually, we have put together the below research piece for your interest. Below we outline how we see EUR/USD trading over the course of 2023 – giving our clients our 3, 6 and 9 month EUR/USD trading forecasts. This will hopefully be helpful over the next few weeks/months as you hedge your EUR/USD exposure.
This is intended to give you a good overview, macro picture – we can obviously help you on a more micro level when you actually need to hedge.
With this as our backdrop we will take a look at the following;
1. Firstly, we will examine how the Dollar has traded over the previous 12 months.
2. We will then look at the principle drivers of this Dollar trend over the course of the past 12 months and more importantly what we feel will be the pertinent drivers going forward for EUR/USD over the next 9 months.
3. Finally we will examine where we see the highest probability of EUR/USD trading on a 3, 6 and 9 month time horizon – bringing us up to year end.
The Dollar’s Performance over the past 12 months
Let us take a bird’s eye view of the recent Dollar trend, dating back to the beginning of 2022. Below is a chart of the DXY Index – the DXY Index represents the strength of the Dollar at any one time versus a basket of major global currencies. EUR/USD makes up over 50% of this basket. As we can see from the chart below – the Dollar Index (DXY) rallied over 21% over the course of 2022 to its peak towards the end of Sept 2022– this was known as the Dollar’s ‘’exceptionalism’’ phase in the financial markets. We have subsequently seen a 12% decline in the Dollar from its peak in Sept, down to its lows at the beginning of Feb this year.
Chart – DXY – The Dollar Index’s performance from 2022 – to present. Volatility is certainly back in the currency markets and a robust hedging strategy is paying dividends.
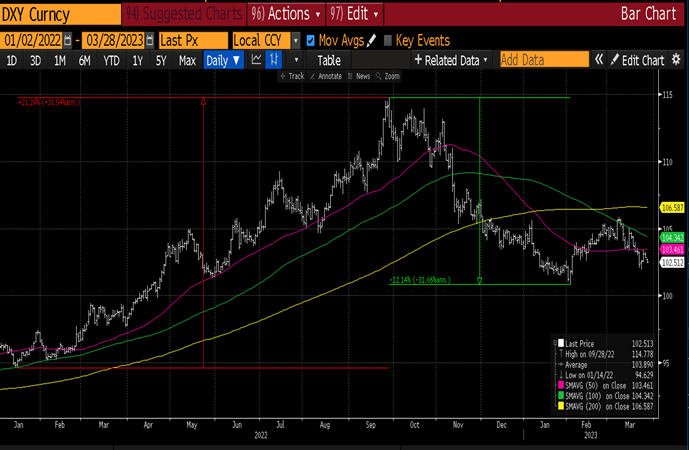
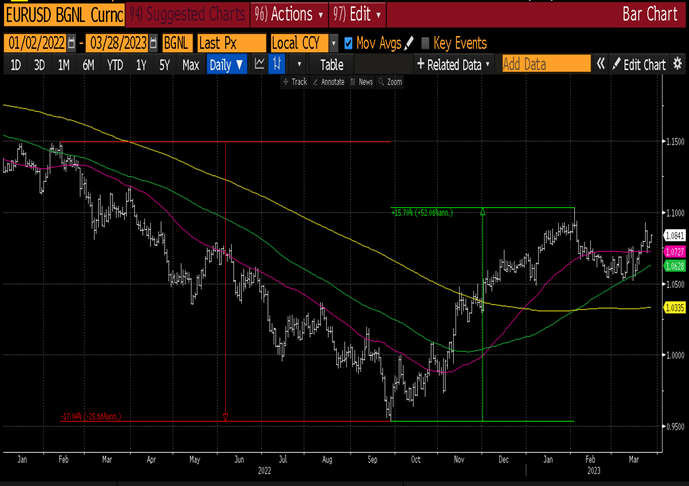
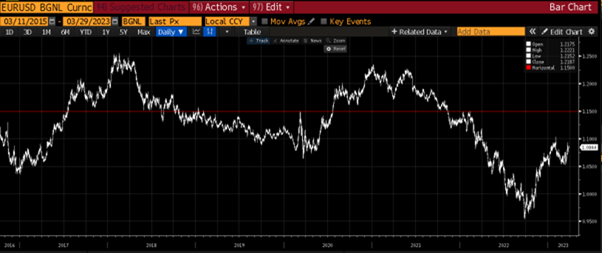
Chart – EUR/USD – Euro’s performance from 2022 – to present. As the US Dollar rallied during this period, the EUR/USD traded lower. As we can see in the chart below we broke parity in EUR/USD (1.00) in Aug 2022, trading to a low of 0.95 in late Sept – which equated to multi decade lows in EUR/USD – levels not seen since 2002 in the currency pair – truly a one off hedging opportunity. We have subsequently rallied over 15% off those lows seen in Sept to the highs just above 1.10 at the beginning of Feb 2023.
So why did the Dollar rally?
We mentioned above that this period was known as Dollar ‘’exceptionalism’’ in the currency markets, during and up to Sept 2022. The driver of Dollar strength largely stemmed from the actions of the Federal Reserve (Fed). The Fed was one of the first G10 central banks that embarked on an aggressive interest rate hiking cycle to curb runaway inflation in the US. Interest rate differentials are one of the major drivers of currency strength – so hence the higher the interest rates in a G10 country, usually the stronger the currency – this yield play attracts buyers of the higher yielder. The Fed aggressively hiked interest rates during this period from 0.25% to 5.00% – see chart below
Chart – the below chart demonstrates the consistent and aggressive month on month increase of interest rates in the US from Jan 2022 to present – where interest rates moved from 0.25% to 5%.
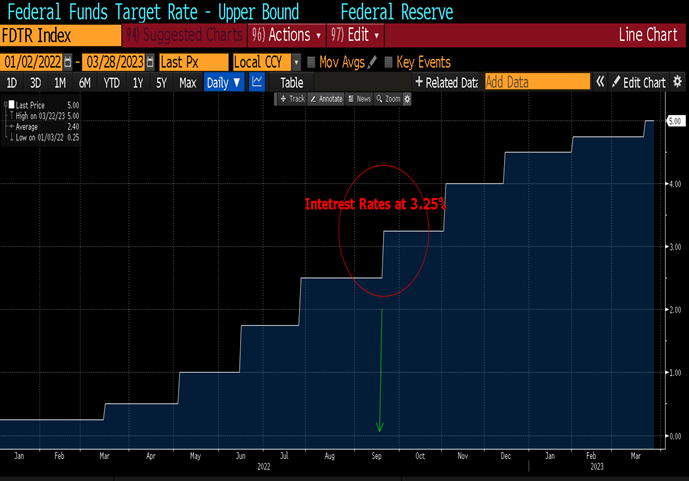
So, if interest rate were only at 3.25% in the US in Sept 2022, why did the Dollar top out back then and begin to weaken?
Well there were a number of factors beginning to play out back in Sept 2022. Firstly other global central banks had begun their interest rate hiking cycle. The US Dollar had rallied a long way – it was trading at multi decade highs. Inflation was also showing signs of slowing down in the US and the market felt the Fed would have to ease up on its hiking cycle soon, as the first whispers of recession in the US began to emerge. So the exceptionalist shine on the Dollar began to fade and the Euro began to recover versus the greenback.
The Euro recovered some 15% versus the Dollar up to the beginning of Feb this year, as the ECB begin its interest rate hiking cycle and recession fears hit the States. Feb’s economic releases out of the US however once again turned everything on its head – inflation stopped falling, the economic survey and sentiment indicators all turned positive and Feb’s employment report was a monster release.
Recession, what recession……! We pivoted from the Fed potentially cutting interest rates by year end, to interest rates now remaining higher for longer, with the financial markets pricing in fresh rate hikes. The macroeconomic picture completely flipped in Feb and remained positive until…… the SVB crisis and what could still turn into a full regional bank crisis in America.
It is incredibly unusual for these bigger picture macro views to flip flop within a matter of days, however these black swan events create such market volatility and turmoil– longer term views are forced to pivot.
Post the SVB crisis and subsequent Credit Suisse collapse we have quite quickly found ourselves back to Jan 2023 environment with regards to currencies – and that is the potential for a lower Dollar on the back of the Fed having to dramatically slow it’s interest rate hiking cycle – we currently have only one more 0.25% hike priced into the yield curve in the US, with a 0.25% cut in interest rates by the Fed priced in by year end.
Given how currencies have behaved throughout 2022 – we feel this will be the principle driver for the Dollar over the next 9 months.
So with US interest rates looking like they will top out next month in the US – leaving the terminal rate at 5.25%, a potential further escalation of the regional banking crisis – A member of the Federal Reserve Committee – Neel Kashkari –was quoted over the weekend – “Not all of these stresses are behind us. I expect this process will take some time…..Sometimes it takes longer for all the stresses to work their way out of the system … we know that there are other banks that have some exposure.” – We feel there is a higher probability is for a lower Dollar over the course of the next 3, 6 and 9 months.
Where to in 3, 6 and 9 months’ time?
3 Month Horizon – a break and weekly close above the yearly highs at 1.1033 is the first step that is needed. A break of this level should attract further buyers to the market and our target for the 3 month horizon for EUR/USD is 1.1200 – into the major pivot zone dating back to 2019, as shown on the chart below with the green line.
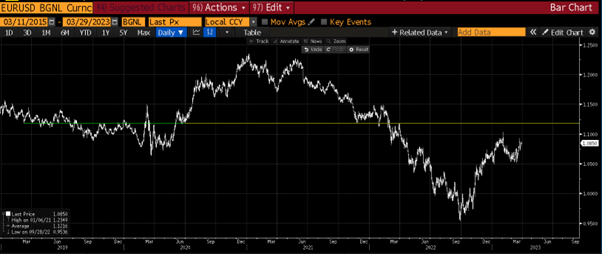
6 Month Horizon – The 1.1200 maybe a tough nut to crack however over the 6-month horizon we ultimately feel EUR/USD should rally through this resistance/pivot point and extend its move up to 1.1500 – where again we come up against major resistance – see chart below – red line represents further topside resistance.
9 Month Horizon – a clean break of the 1.15 level in EUR/USD should allow us to finish the year in the 1.1800-1.2000 zone. A slightly wider target here, however it is 9 months out.
Major risk events on the horizon
Major risk events on the horizon which may derail these forecasts – worth keeping on the radar.
1. Further contagion in the US from the SVB crisis to other regional banks
2. April’s employment figures out of the US – 7th April.
3. April’s Inflation figure out of the US – 12th April
4. Federal Reserve Interest Rate decision – 3rd May
5. ECB interest rate decision – 4th May
Treasury First is powered by Assure Hedge (UK) Limited, a company incorporated in England and Wales (No.10723112) with its registered office at 45 Eagle Street, London WC1R 4FS, UK, is authorised and regulated by the Financial Conduct Authority of the UK (FRN:783837). Assure Hedge Limited, the parent company, is incorporated in Ireland (No. 578153) with its registered office at Dogpatch Labs, CHQ Building, North Wall Quay, Dublin 1, Ireland.
This email and any files transmitted with it are confidential and intended solely for the use of the individual or entity to whom it is addressed. If you have received this email in error, immediately notify the sender by reply email and then permanently delete this email and your reply. Unauthorised use, disclosure, storage or copying of this email is not permitted. Whilst every endeavour is taken to ensure that emails are free from viruses, no liability can be accepted for any damage arising from using this email. Treasury First does not guarantee the accuracy or reliability of information in this message, and any views expressed are not necessarily the views of the company.
Sterling – Oops…..Looks like Bailey did it again…….
Sterling – Oops…..Looks like Bailey did it again…….
Sterling – Versus the Euro
In our report last week, we spoke about potential green shoots in the UK economy –as a number of positive economic data points compounded some sanguine developments with the Northern Ireland Protocol. All of the above had allowed the Sterling to appreciate, particularly versus the Euro over the course of last week and into the start of this week, taking us below the 0.8800-0.8790 zone in EUR/GBP or above the 1.1400 level in GBP/EUR terms – for the first time since mid-January.
With a large portion of the market still very bearish on the UK, we went into this with high hopes that improving economic sentiment may begin to change minds. This week’s key risk event was a speech by the Governor of the Bank of England, Andrew Bailey and unfortunately, he did not read the new wave of optimism. In fairness he did not deviate massively from his speech following the interest rate decision by the Bank of England in Feb – however, he failed to fuel any of the newfound optimism the market was feeling from last week and firmly halted any further appreciation of the Pound versus the Euro or the Dollar –
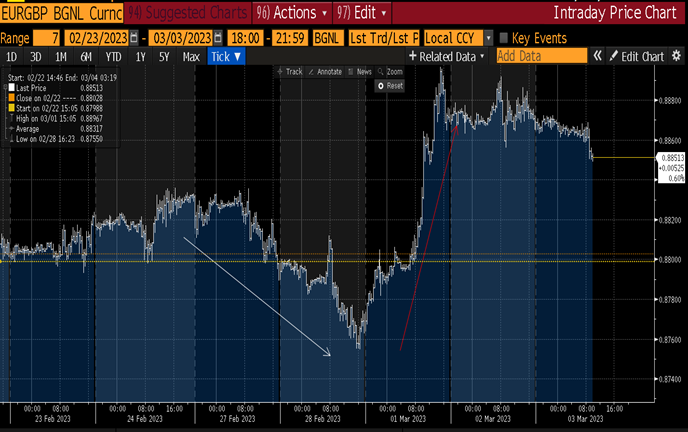
Weekly Chart of EUR/GBP – Trending nicely lower until Bailey’s Speech on Wednesday –
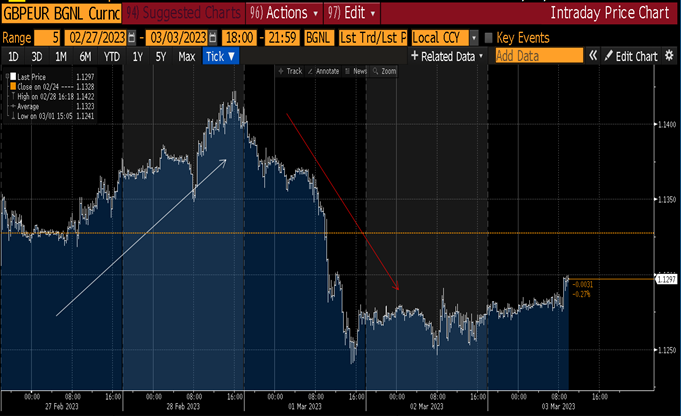
In GBP/EUR terms – trending nicely higher – until the Central Banker dampen the parade
So what did he say?
As we mentioned above, it was not wholly his fault – he very much towed the party line from the interest rate meeting in early Feb – the issue here is the markets have moved on and during the month of Feb, we had seen a significant repricing of global interest rates – ie the market is now looking for interest to rise more than they had expected in Jan of this year. So it was Bailey’s comments or lack of future interest rate hikes that caught the market wrong-footed. UK bonds were looking for a more hawkish tone from the Governor and when he did not deliver they began to price out interest rate hikes and we saw a subsequent sell-off in the Pound. The issue here is the market is certainly not in the same place as it was pre-Feb’s MPR, given the impressive re-pricing we have seen throughout Feb.
So we are back down at the bottom of the recent range in Sterling versus Euro and all last week’s hard work is undone. We now have to wait and see what March brings and whether we can keep the momentum up in the recent positive set of UK data.
Treasury First does not guarantee the accuracy or reliability of the information in this message, and any views expressed are not necessarily the views of the company.
Treasury First is powered by Assure Hedge (UK) Limited, a company incorporated in England and Wales (No.10723112) with its registered office at 45 Eagle Street, London WC1R 4FS, UK, is authorised and regulated by the Financial Conduct Authority of the UK (FRN:783837). Assure Hedge Limited, the parent company, is incorporated in Ireland (No. 578153) with its registered office at Dogpatch Labs, CHQ Building, North Wall Quay, Dublin 1, Ireland.
EUR/GBP – Where To Now?
EUR/GBP, GBP/EUR or ‘’The Cross’’ as it is known amongst currency traders –
EUR/GBP or GBP/EUR, as many of our clients like it quoted as, is a heavily traded currency pair, opening up trade between the EU and the UK. Vast volumes go through this currency pair on a daily basis in the FX markets, with many industries and their profits hugely sensitive to fluctuations in this exchange rate.
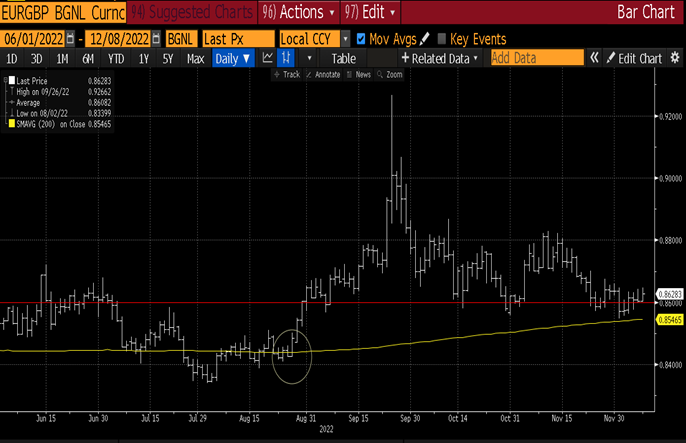
In this week’s currency report from Treasury First, we look at the performance of EUR/GBP over the course of 2022 and hopefully garner some insights into its future path into year end and beyond into 2023 – we feel the 0.8600 level in EUR/GBP holds the key here.
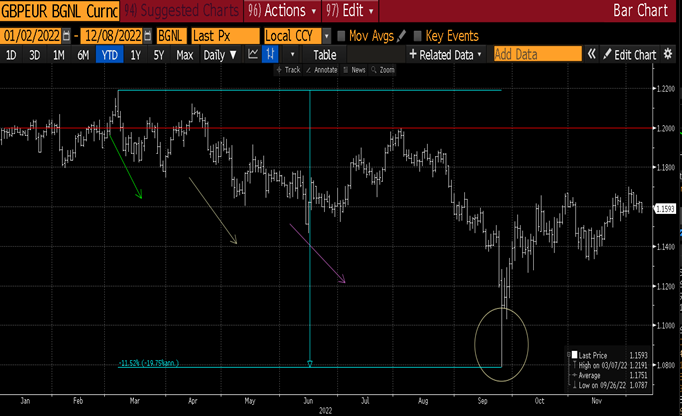
We started 2022 with GBP/EUR trading at the lofty heights of 1.20 level – making exporters of goods into Britain from the EU very competitive indeed – we had not been at these levels since 2016 – pre Brexit vote.
This trade began to lose momentum post the Ukraine invasion by Russia and the old ‘’risk off’’ dynamics of the financial markets kicked in. GBP/EUR began to head south as we can see from the chart below.
GBP/EUR – begins to lose topside momentum in March 2022, moving off the 1.20 level – red line on chart and heads south, as financial markets trade in ‘’risk off’’ mode following the Ukrainian invasion. By the end of the summer focus has now firmly shifted to the UK itself and the weakening economic backdrop – see circle highlighted on the chart – showing GBP/EUR dipped below 1.08 – from the 1.20 level at the beginning of the year – falling over 10%
EUR/GBP –
In EUR/GBP terms the 0.8600 level has been pivotal over the course of 2022, as the currency pair has oscillated around this zone. As can be seen from the chart below – the red line has defined us for this year’s trading – spending the majority of the year below 0.8600 – Euro weakness and Sterling strength – until finally the focused shifted the UK economic fundamentals in late Aug. From Aug onwards we have spent the majority of our time above the 0.8600 – classic case of old resistance, now acting as new support for the currency-
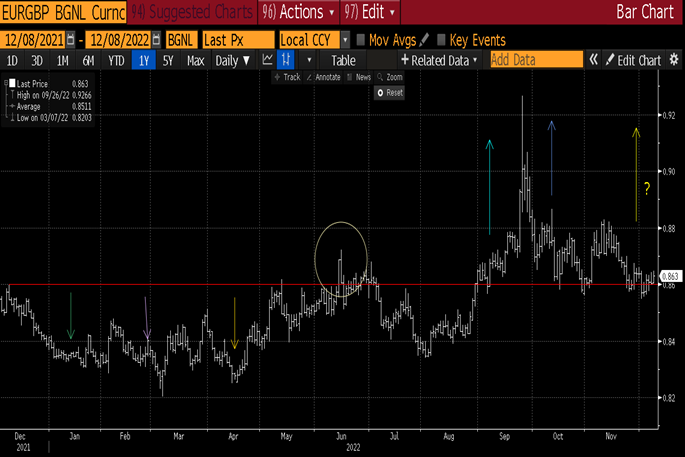
The longer we remain above this red line – 0.8600 in EUR/GBP terms and 1.1628 in GBP/EUR terms, the higher the probability that renowned topside momentum enters the market and takes us higher in Euro versus Sterling in the coming months.
So what should we be looking out for into year end and beyond?
Firm weekly closes in the currency pair above 0.8600 would indicate to us that the path of least resistance is higher and that we could see a significant break of the range that defined us in 2022 and a move in the 0.9000 zone or 1.11 in GBP/EUR terms.
However a weekly close below 0.8600 and weekly close below the 200 day moving average – yellow line in chart below –which we have not been below since Aug 2022 – would be a very bearish signal and should indicate a move back towards 0.83-0.82 zone or the 1.20 level in GBP/EUR terms.
EUR/GBP – the two bearish indicators to watch – a weekly close below both the 0.8600 level and the 200 day moving average would indicate a move back to the 0.8300-0.8200 zone or 1.2000 level in GBP/EUR terms.