Category: Uncategorized
Daily Morning FX Bites – 27th September 2024
|
|

User Guide

Week Ahead 8th April – 12th April 2024
The Week Ahead –
What’s Going On?
As highlighted throughout our reports so far this year the currency markets have been stuck in tight ranges, with the dominant theme being Dollar strength – which is in complete contrast to the end of 2023, when the Dollar was on the back foot. Overall ranges remain intact so far this year in the currency markets; however intra-week volatility is increasing as we approach some important central bank meetings, which should differentiate the stronger currencies from the weaker ones, as certain countries cut interest rates ahead of others. Last week saw the US once again demonstrating its exceptionalism ahead of its peers, with ISM beating the markets expectations and Friday seeing a very strong jobs report. A stronger than expected inflation report this Wednesday out of the US could kick the now expected first interest rate cut from June to further down the line.
Both the Euro and the Pound remain down towards the lower half of their yearly ranges versus the Dollar and have failed to regain the 1.09 and 1.27 levels respectively. EUR/GBP continues to hold above 0.8550 for the majority of last week, however the Euro could come under renewed pressure versus the Pound this week with the ECB meeting on Thursday, which should be dovish, signalling to the market that the first 0.25% interest rate cut will come at the following ECB meeting in June.
Performance of G10 currencies versus the Dollar last week –
EUR/USD – up 1.15%
GBP/USD – up 0.8%
AUD/USD – up 1.6%
USD/JPY – up 0.6%
Levels in G10 to watch this week –
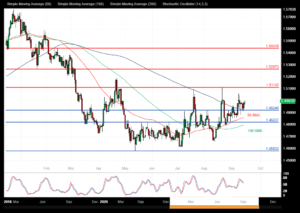
EUR/USD – Having broken the 1.0800 support level last week, we traded to a low of 1.0725 and subsequently bounced of this level, in what was a volatile week of currency markets. The topside resistance now comes in at 1.0885-95 and 1.0725 is now the downside target.
EUR/GBP – we still have not traded convincingly above 0.8600 level in EUR/GBP and we need to break above the 100 and 200 day moving averages that come in around 0.8585-0.8605 this week to indicate further topside momentum. 0.8500 still remains the major support level below.
GBP/USD – As with EUR/USD we broke below the major support in Cable at 1.2600, trading to a low of 1.2540 last week before bouncing hard. A move back above 1.2700 is now needed to ensure we do no continue the downtrend.
Week Ahead –
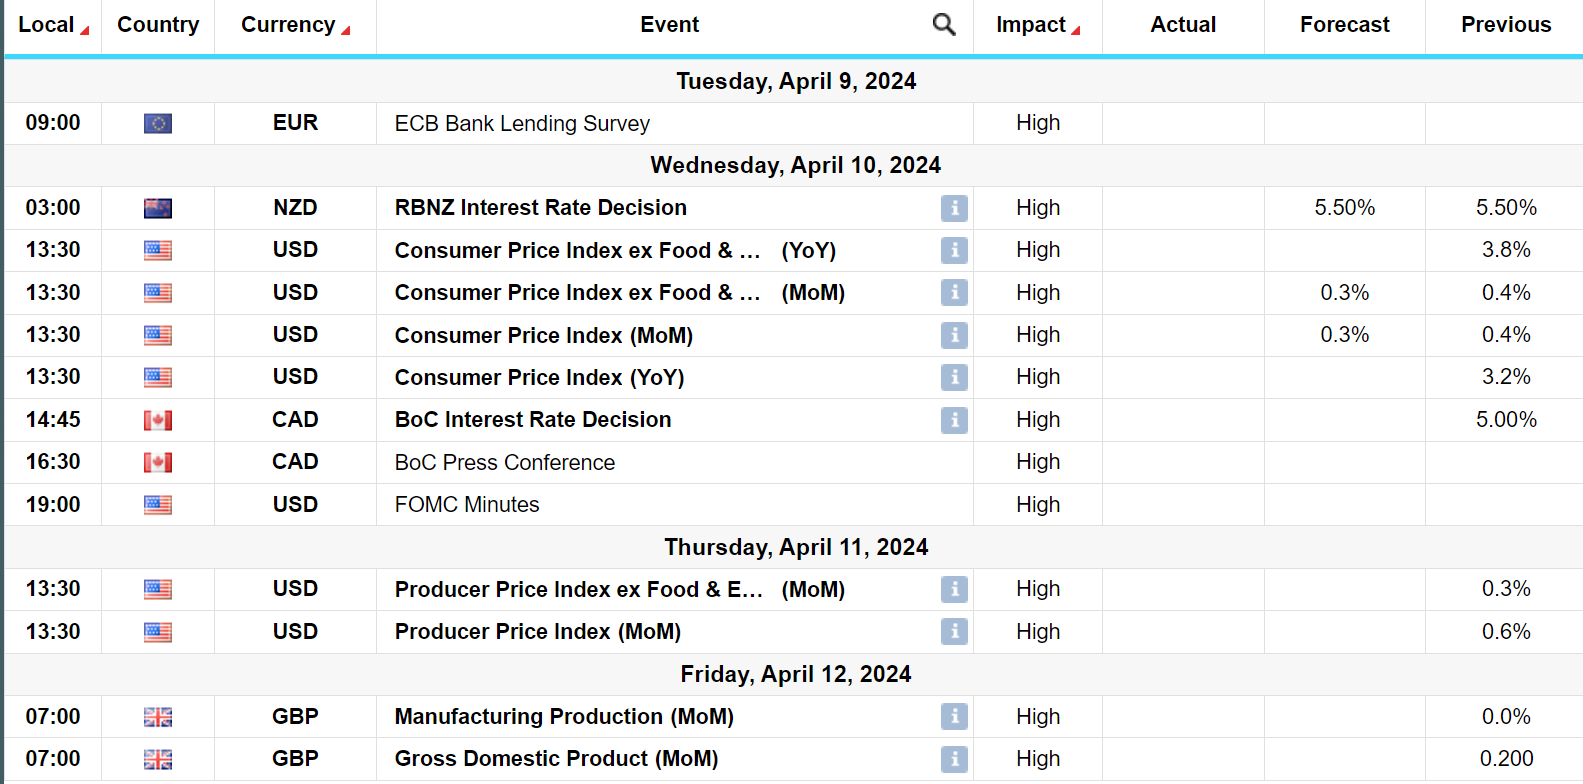
We have plenty of central bank interest rate decision meetings this week, with the New Zealand, Canadian and ECB meetings all on the cards.
On Wednesday we have interest rate decisions in New Zealand. The RBNZ will most likely be on hold and there appears to be a high bar for them to shift rates in either direction for now. We expect them to leave interest rates again at 5.5% where they have been since May last year.
Also on Wednesday we have interest rate decisions in Canada – The Bank of Canada is again seen holding its policy rate at 5%, although odds have grown that it at least partially paves the way for a first cut in June.
Wednesday’s US CPI report for March provides the main data interest of the week and could help set the tone for the May 1 FOMC decision despite being so far out. The surprise acceleration in core CPI and PCE measures over the first two months of the year has for the most part seen FOMC participants have less confidence in a sustainable return to 2% inflation.
The ECB is unanimously expected to leave rates on hold at its April meeting, with most focus on the framing of communication surrounding a likely rate cut in June. Markets are almost fully pricing a first 25bp rate cut in June, and recent ECB communication has seen Governing Council members across the hawk-dove spectrum seemingly converge towards this meeting as the likely candidate to begin its easing cycle.
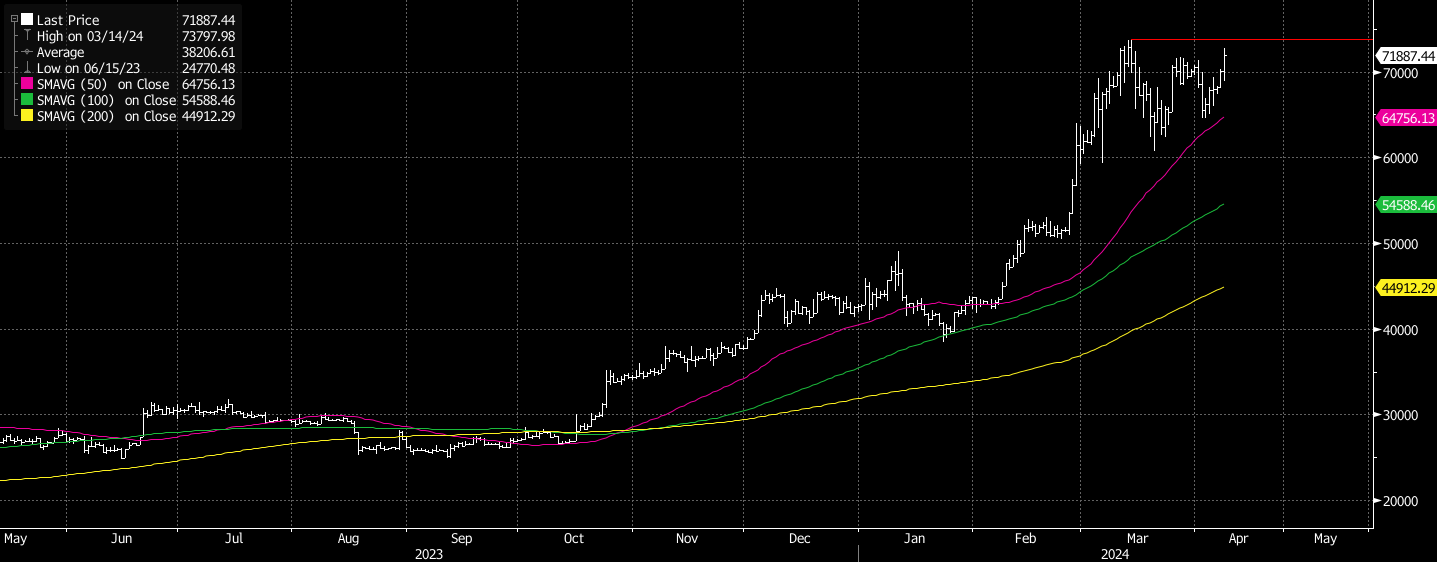
Chart of the Day – Bitcoin – Worth keeping an eye on Bitcoin this week to see if it can make fresh all-time highs – $72,910 is the target – red line on chart.
A Focus on EURGBP
The EUR/GBP or the cross as it is also referred to in the FX markets has become very interesting of late. We highlighted at the beginning of this week that GBP/USD was outperforming EUR/USD and that led to an interesting subplot in EUR/GBP. For the past number of weeks EUR/GBP threatened to break out above 0.88, as we trade on a high 0.87 handle. Better than expected UK data however in Nov had seen this trend reverse, as we traded back below 0.87. Going into this week the all-important support level 0.8650 was fully in view. We took out this support level yesterday, as lower than expected inflation report was released from the Eurozone, which saw Euros sold across the board.
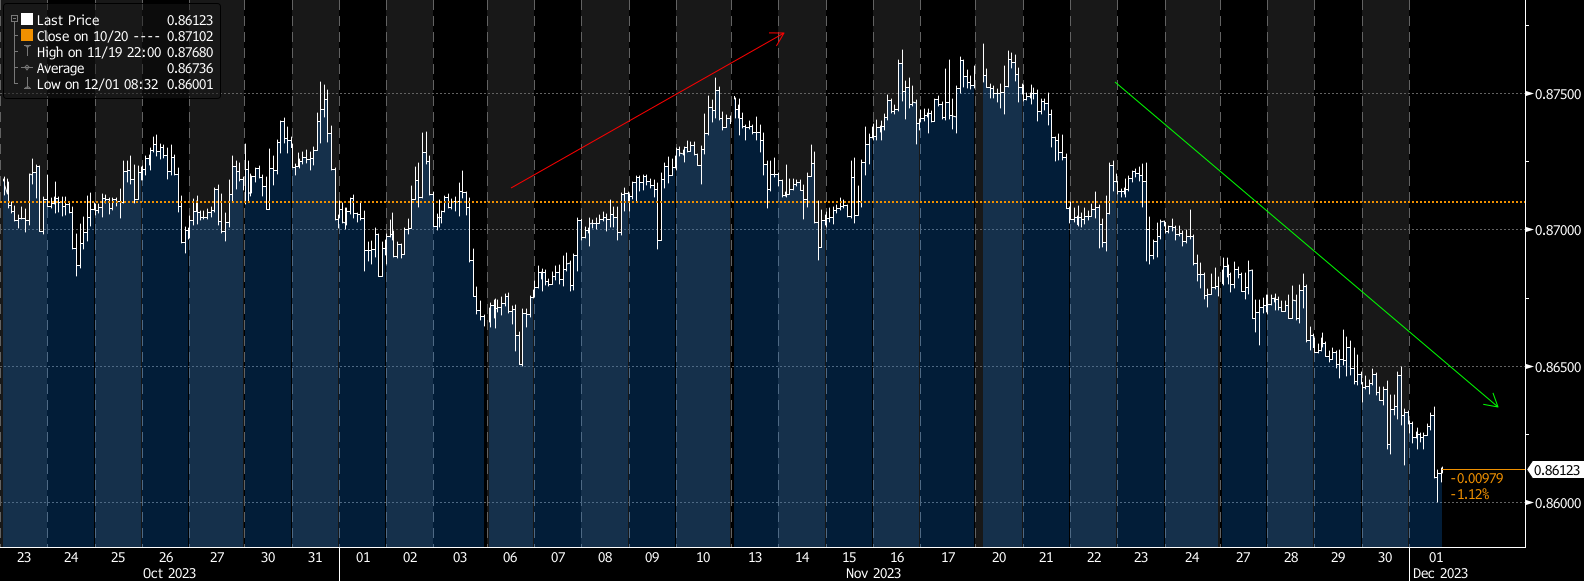
EUR/GBP – 30 day chart of EUR/GBP – we can see how improving UK data released mid Nov initially turned the higher trend in EUR/GBP – red arrow. This was compounded yesterday with the weak Eurozone inflation report, Euros were sold.
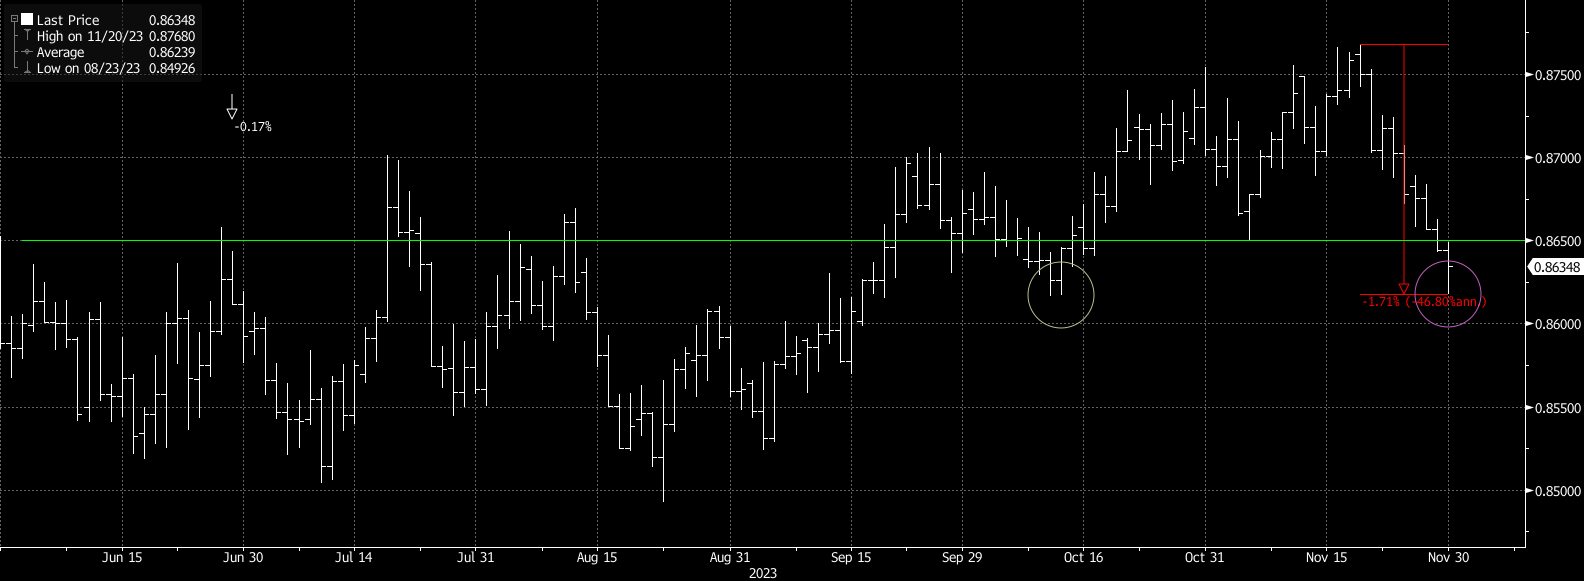
If we take a step back and look at the yearly chart of EUR/GBP we can see that we are right in the sweet spot to buy Euros and hedge EUR/GBP exposure. Over the past 10 days we have sold off nearly 2.00% in EUR/GBP and currently sit right on support at 0.8600. The 7 month range in EUR/GBP has been 0.8750 – 0.8500. The median of this range has been 0.8625. A weekly close below 0.8600 would indicate further downside momentum into next week, however when looking at the below medium term chart, we can see the value in EUR/GBP at its current levels.

Daily FX Bites 30th November 2023
Welcome to our daily morning FX Bites email. A 30 second snap shot of the key economic releases and risk events that lie ahead from across the global. We have kept it concise and clear; however containing all the information you need to ensure you are up –to-date with the latest market moving events in the world of foreign exchange – from economic data releases to the latest central bank speakers.
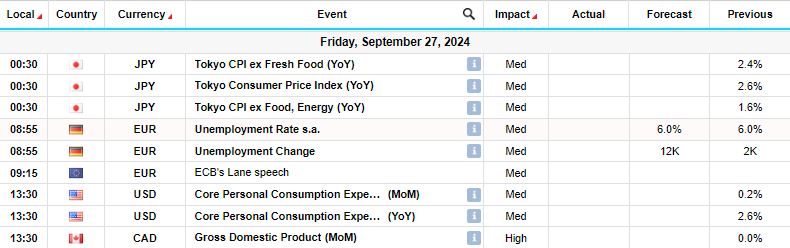
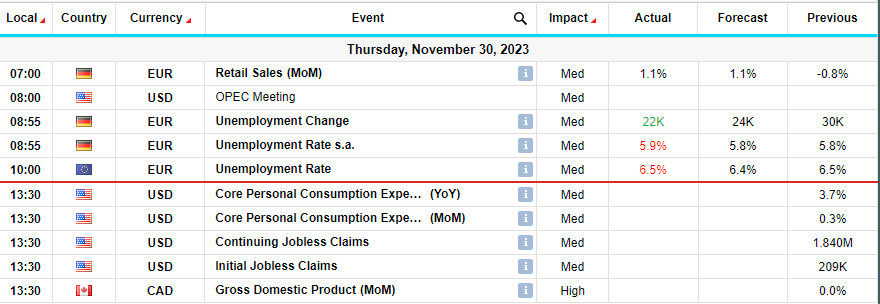
Economic Table
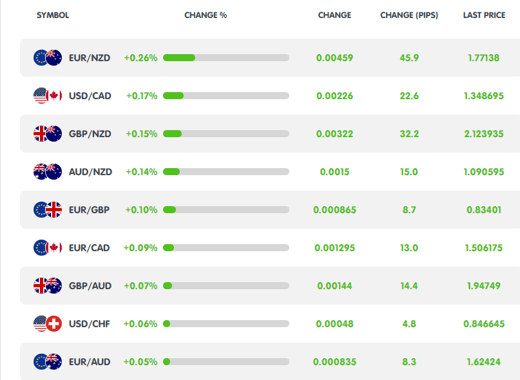
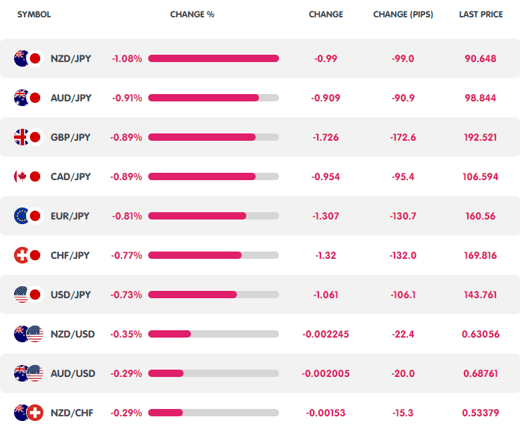
Seeing Increased Volatility in the FX markets
The dominant theme in the FX markets is Dollar weakness, with the majority of the FX mayors rallying against the greenback. The perceived wisdom here is that the US Federal Reserve is done hiking interest rates and will not hike at their December meeting – US interest rates are currently at 5.50%. US yields have sold off considerable over the month of November – 10 year US interest rates are at 4.27% having traded above 5.0% in October. This loss of yield and softening US economic data has seen the Dollar sell off on average 4.5% versus G10 currencies.
This morning we have seen a slight reversal in this lower Dollar trend, particularly versus the Euro, as the Dollar has rallied on the back of weaker than expected inflation report out of France and Germany and then the Eurozone wide release. We have also seen the Euro selloff against Sterling on the back of these economic figures – with EUR/GBP breaking through very decent support at 0.8650 and trading to a low of 0.8617 so far.
Eurozone core inflation came in at 3.6% year on year versus market expectations of 3.9% – an impressive decrease from 5.7% in March of this year.
Day’s Highlights –
At ‘’ High’’ on the importance scale this afternoon we have – Chicago PMI – this is a very good activity indicator for the US economy and it will be monitored closely – 46.00 is expected by the markets.
Major levels to keep an eye on this week –
EUR/USD – All eyes on the physiological level at 1.1000 which we have broken briefly this week already – Euro has sold off this morning on the back of weaker than expected inflation figures – the first downside level of note is 1.0900- 1.0890 support.
GBP/USD – GBP/USD is outperforming the single currency and although it has sold off from the initial break of 1.27 earlier this week, it is holding onto its gains versus the Dollar and remains above decent support at 1.2600
EUR/GBP – As mentioned above – GBP/USD is outperforming EUR/USD and this has led to an interesting subplot in EUR/GBP. For the past number of weeks EUR/GBP threatened to break out above 0.88, as we trade on a high 0.87 handle. Better than expected UK data, has seen this trend reverse, as we trade back below 0.87 and on the back of weaker than expected Eurozone inflation figures this morning we have finally broken through the 0.8650 support trading to a low of 0.8617 so far.
Chart of the Day – EUR/USD
EUR/GBP– see below a 6 month chart of EUR/GBP – we have sold off some 1.7% in EUR/GBP over the past 10 days, trading below significant support and pivot zone at 0.8650 – see green line on chart. The low so far on this move this morning has been 0.8617, matching the lows seen towards the end of Sept –see circles on chart – a break and daily close below 0.8600 would be very significant.
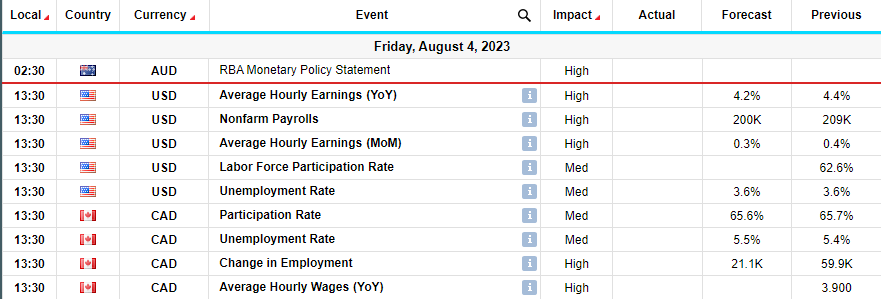
Daily FX Bites 4th August 2023

 |
 |
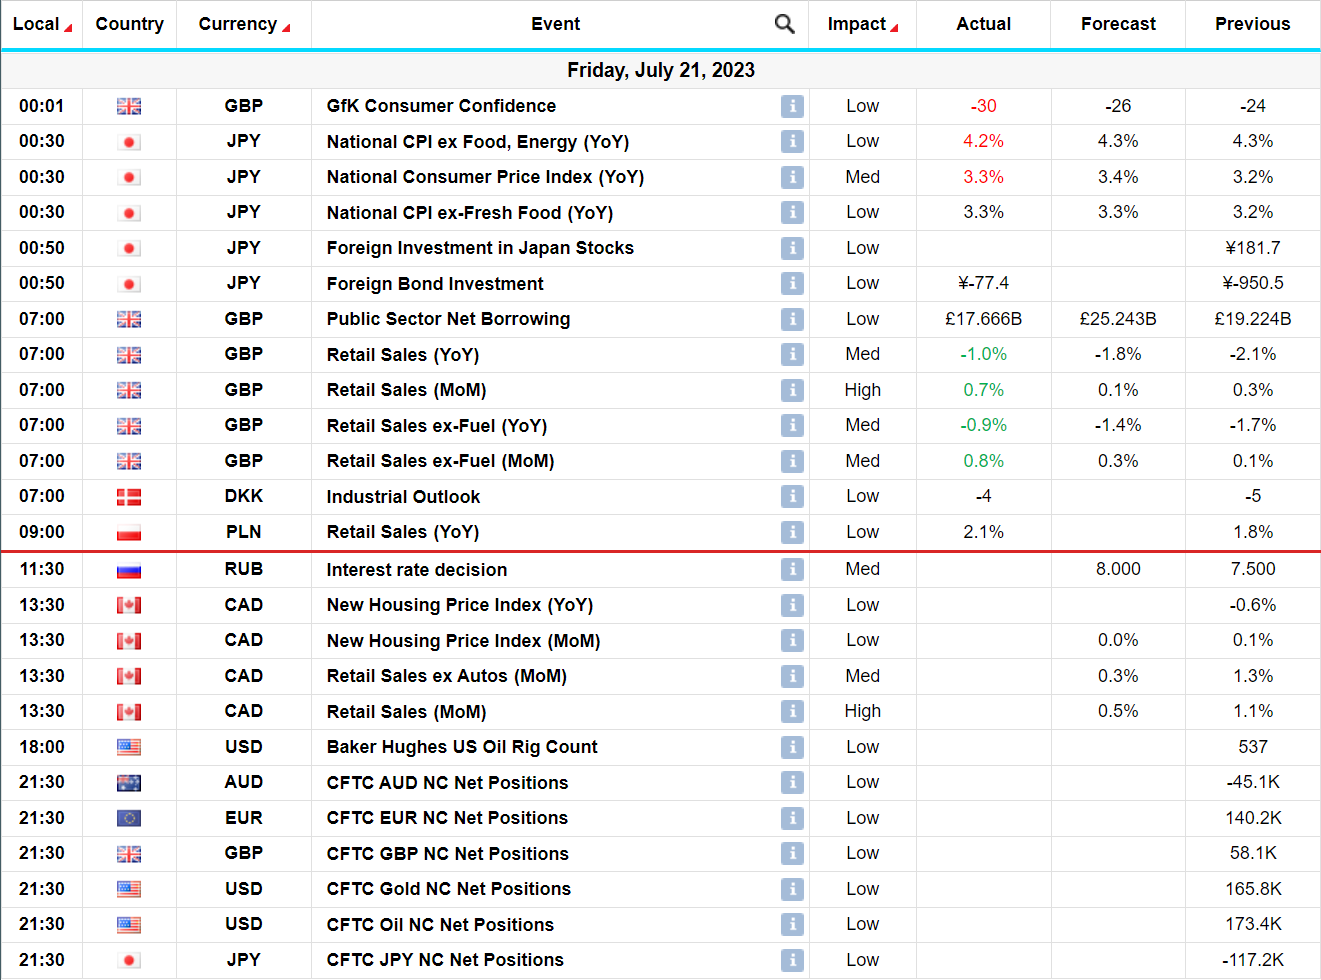
Daily FX Bites 21st July 2023
Welcome to our daily morning FX Bites email. A 30 second snap shot of the key economic releases and risk events that lie ahead from across the global. We have kept it concise and clear; however containing all the information you need to ensure you are up –to-date with the latest market moving events in the world of foreign exchange – from economic data releases to the latest central bank speakers.
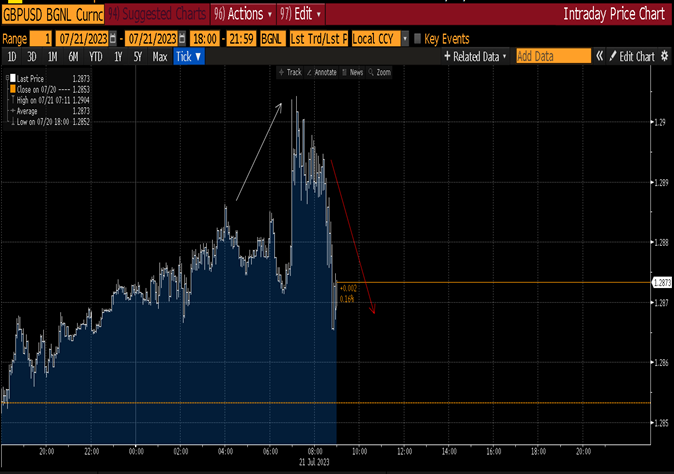
What’s Going On?
Today’s Highlights – The Dollar continues its recovery this week lead by USD/JPY and GBP/USD. A weaker Inflation Report out of the UK earlier in the week was the catalyst for Sterling to sell off versus the Dollar and GBP/USD remains below the all-important 1.2950/1.30 level. This Dollar strength has fed into EUR/USD as well – trading off its highs seen last week above 1.1250 and currently trading down towards the 1.11 level.
We have just had the following comments from the Bank of Japan this morning –
-BOJ IS SAID TO SEE LITTLE NEED TO ACT ON YIELD CONTROL FOR NOW
-BOJ IS SAID STILL NOT CONFIDENT ABOUT HITTING PRICE GOAL STABLY
This takes any chance of a shift in monetary policy at next week’s Bank of Japan meeting off the table and has sent USD/JPY nearly 1% higher. This should add to further Dollar strength in the G10 space over the course of today’s session.
At ‘’ High’’ on the importance scale we had – Retail Sales out of the UK this morning at 7.00am. We had a better than expected print for retail sales across the board. That’s now 5/6 prints this year surprising to the upside. We initially saw Sterling strength, however the larger Dollar strength theme has subsequently taken over and the Pound has sold off versus the Dollar.
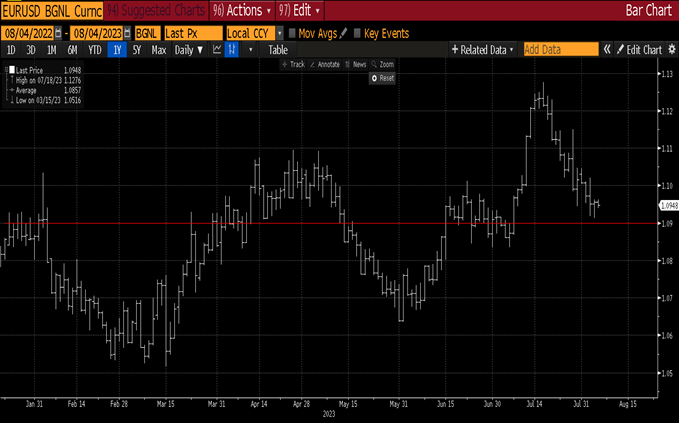
Chart of the Day – Initial Sterling strength on the back of stronger Retail Sales out of the UK this morning, however the larger Dollar theme has subsequently taken off.
Treasury First– Mid Week Macro Report 20 October 2021
Treasury First– Mid Week Macro Report 20 October 2021
To say the market is in a transitional period is a slight understatement. Global Central Banks are actively acting against the rise in inflation as interest rise or are set to rise. We are in the midst of a Global energy crisis as the northern hemisphere enters the winter months. Supply chain bottlenecks are filtering through into every aspect of the global economy. Covid-19, despite the rollout of a successful vaccination campaign, continues to weigh heavily on our global health systems. All these cross winds make clear directional plays within the financial markets very tricky at present. They do however create volatility, which in turn creates opportunity, with many investors believing these next few months will be the start of a wider, more drawn-out trend in the financial markets. Something that has been difficult to come by in 2021 so far. So these are indeed exciting times for investors and traders. For us the key driver over the next few months and what will set the broader trend in all asset classes is the US Fixed Income markets. Yields are back rallying following their pause during the summer months as the broader markets are focussing in on the growing risk of inflation rising across the globe. The rise in energy and commodity prices in particular has been joined by increases in consumer goods prices, particularly food stuffs. Shortages are plaguing many retailers and earnings are expected to highlight supply chain issues and bottlenecks along with production difficulties and labour shortages. In saying that, 80% of the US corporates that have released their 3rd Q earnings have beaten the market’s expectations. The central banks, in particular the Bank of England, Norges Bank and the Central Bank of New Zealand, are beginning to worry that inflations is growing out of hand, coupled with a worker shortage across key economic sectors and in light of this have or are about to raise interest rates. Economic data will be closely watched in the days and weeks ahead and the markets are also factoring in a taper in asset purchases programs by the US Fed. As such markets are in a transition period with external and internal market dynamics at play and ultimately plenty of opportunities.
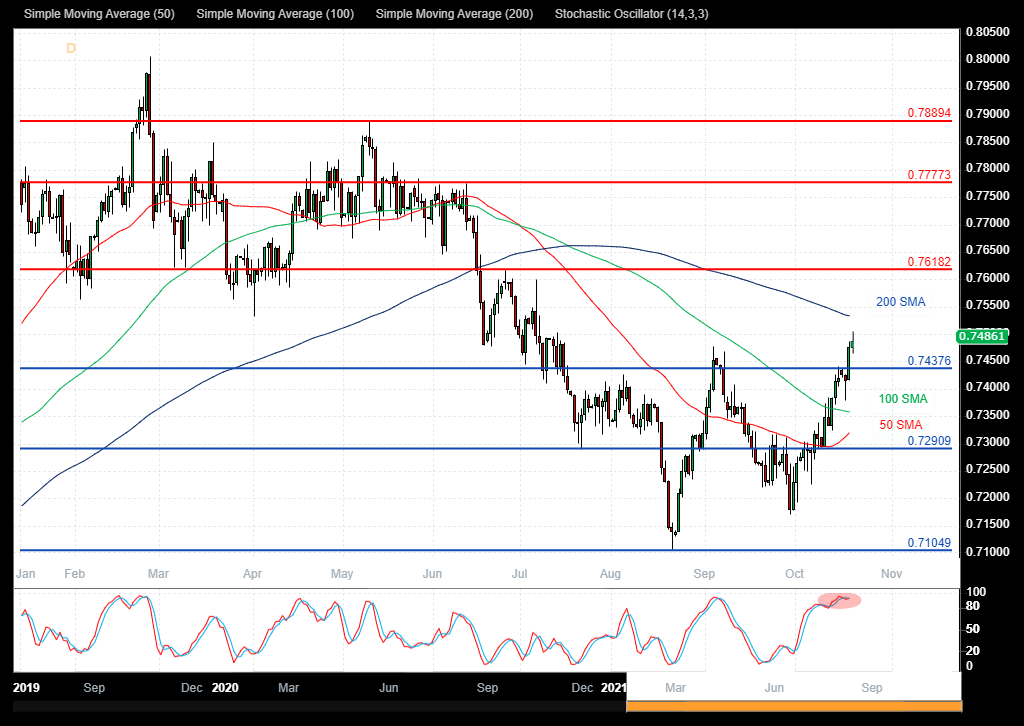
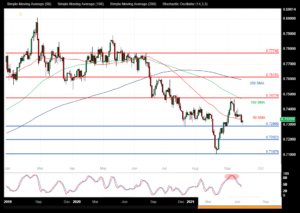
AUDUSD
The AUDUSD FX pair is trading at 0.7497 after breaking above the 0.7475 level as resistance. Price tested resistance at the 0.7500 and rejected lower. The pair is trending higher after its break out around the 50 and 100 SMA but is potentially overstretched as it approaches the 200 SMA at 0.7530 as indicated by the stochastic. A confirmed breakout above this level and the 200 SMA, opens the way to resistance at the 0.7618 area followed by 0.7700 and 0.7777. Alternatively a move down under 0.7437 opens the way to support at 0.7350 and the 100SMA. This area of support is followed by further supports at 0.7300 and 0.7150.
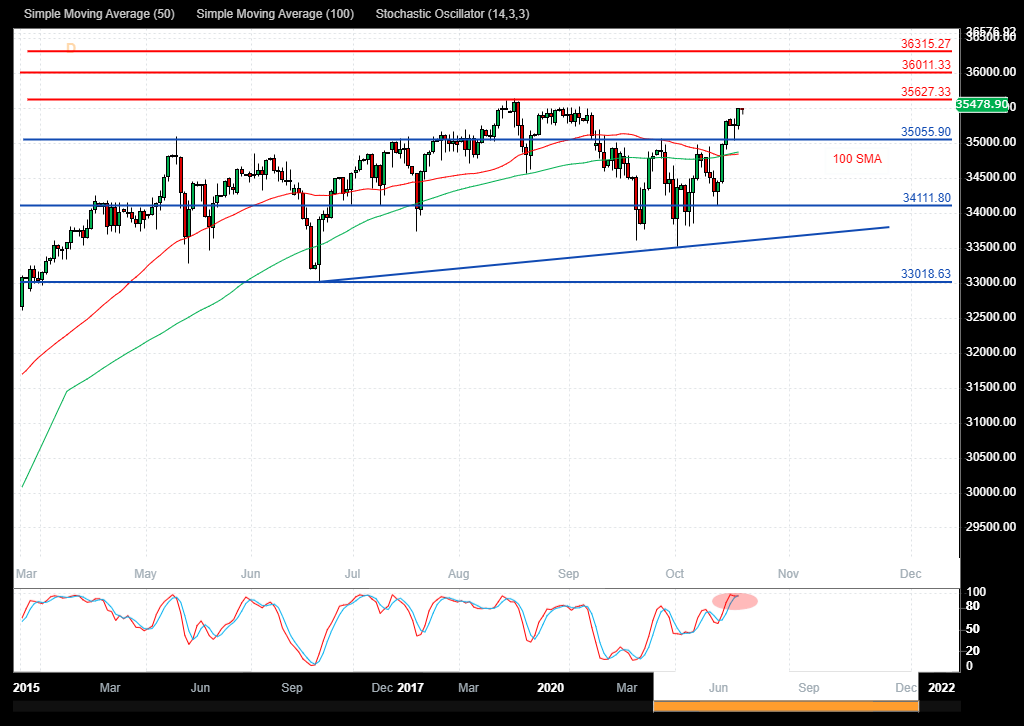
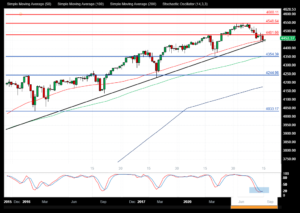
Wall St 30 Index
The Wall St 30 Index has consolidated over recent months and is now testing the resistance area of the last higher high cluster around 35500.00. The stochastic is flashing an overbought warning and the 33500.00 area of support is corresponding to the neckline for a head and shoulders/double top pattern. A selloff below that area would trigger the pattern with a target around 31500.00. The pattern would become invalid with a move back above 35650.00 and a push over 35800.00. If the market breaks above the resistance area at 36000.00, the way opens potential for a rally toward 36300.00. Alternatively, a move back below 35000.00 signals a test on the support at 50 and 100 SMAs around 34850.00 The 34110.00 area then becomes supportive followed by the 34000.00 round number level. Below this level the 33500.00 area would be used as support followed by 33000.00.
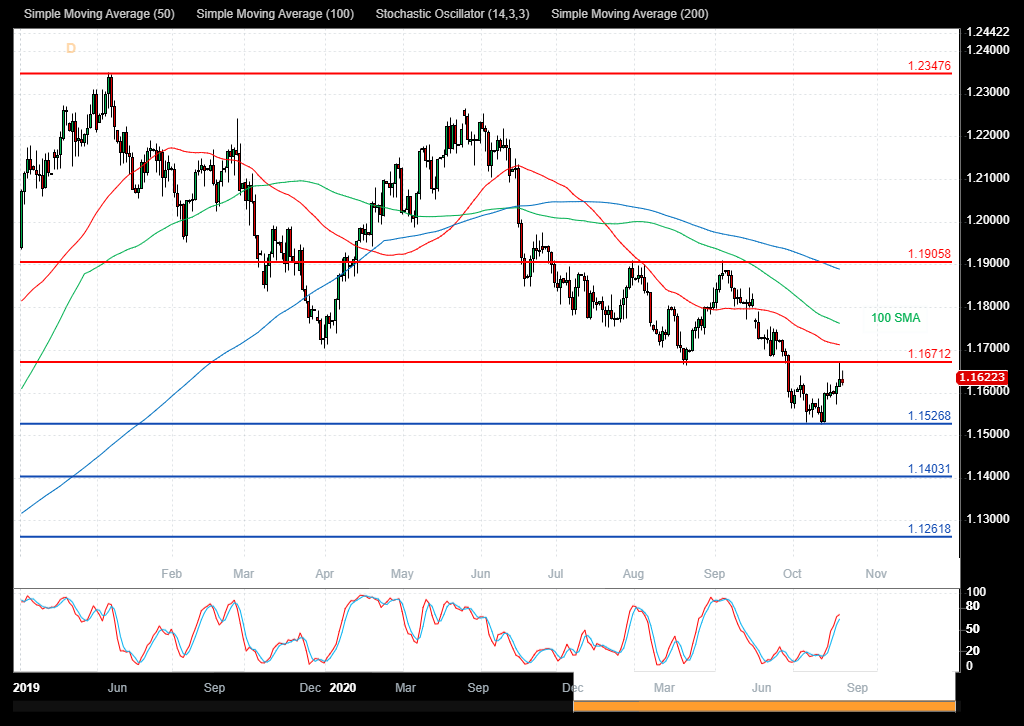
EURUSD
The EURUSD is showing how the price has sold off to test support at 1.1525 to start the month. With price now trading at 1.1640, resistance can be seen at 1.1670 and 50 SMA at 1.1705, while support may be found at 1.1600. The 1.1800 area is expected to act as resistance in the short term, followed by 1.1900 as it relates to the lower high and the 200 SMA. A break above this level would find resistance at the 1.2000 area. A continued move higher finds more resistance around the 1.2265. A breakout from there opens the way to 1.2347. Alternatively a move back down under 1.1600 would find supports at 1.1525 and 1.1500. A loss of this level extends the control of sellers and opens the way to a test on 1.1400 area followed by 1.1300 and 1.1260.
Mid Week Macro Report 15 September 2021
Treasury First – Mid Week Macro Report 15 September 2021
Growing worries surrounding the cash strapped Chinese Evergrande property group is rippling across markets with the groups May 2023 bonds halted for trade after falling more than 20% overnight.
Chinese authorities stated overnight that the group would not be in a position to pay interest due on 20th September. The group has been scrambling to raise the funds it needs to pay suppliers and lenders. Risks are rising of a default linked to the bank such as smaller Chinese financial institutions and the wider Chinese property market. The groups share price fell to a six year low yesterday amid wild swings in price. The group has over $305B in liabilities with no material progress made in its attempt to sell off assets, as fears intensify that it will be unable to repay investors. Markets are riding waves of risk at present as central banks look to taper their Covid emergency purchases programmes. Economic data is presenting mixed signals and Covid is waxing and waning in various locations. All in all the seasonal weakness in asset prices in dragging prices lower as the risk off sentiment takes hold with Quadruple witching taking place in the equity markets later this week – Quadruple witching refers to four days during the calendar year when the contracts on four different kinds of financial assets expire. The assets on which the contracts expire on that day are stock options, single stock futures, stock index futures and stock index options. These expiries days can bring with them added volatility in the stock markets.
The above is all in the backdrop of weaker US stocks markets over the past week. The price action in stocks was very telling yesterday, as they failed to rally on the back of a weaker CPI figure out of the US. In the past this would have been positive for stocks, as with low inflation the global Central Banks are in no rush to taper or raise interest rates and the monetary stimulus continues. Stock markets should be monitored closely over the remaining trading sessions this week, as they dictate the market’s sentiment and moves in other asset classes.
AUDUSD
The AUDUSD FX pair is trading at 0.7325 after testing the 50 SMA as support and breaking lower yesterday to 0.7300. Price tested resistance at the 0.7775 level in July creating a lower area of resistance and then sold off to the 0.7108 support zone in August. The pair is trending higher since then but us running into moving average resistance. Price is using the 0.7477 area as resistance in the short term. A confirmed breakout above this level and the 100 SMA, opens the way to resistance at the 0.7500 area followed by 0.7600. The 0.7615 area may then be resistive followed by the 0.7700 area. Alternatively a move back down under 0.7300 opens the way to support at 0.7200. This area of support is followed by further supports at 0.7130 and 0.7100.
US 500 Index
The US 500 Index created a high at 4549.00 at the start of the month and is now testing the 50 SMA and the rising trend line at 4450.00 area as the price action remains bullish. If the market breaks above the resistance area at 4500.00, the way opens back to 4550.00. Further resistance comes onto the chart at 4573.00 and 4600.00. The market is creating higher highs and higher lows using the support of the trend line. Alternatively, a move back below 4450.00 signals a test on the support at 4430.00 The 4400.00 area then becomes supportive followed by 4354.00 and the 100 SMA. Below this level the 4245.00 area would be used as support along with 4230.00 as a significant higher low.
EURCAD
The EURCAD chart is showing how the pair has consolidated over recent weeks after reaching a lower high at 1.5200 in April and finding support at 1.4580 in May. With price now trading at 1.5000 as it consolidates after bouncing from support at 1.4600. The 1.5100 area is expected to act as resistance in the short term. A break above this level would find resistance ahead of 1.5200. A continued move higher finds more resistance around the 1.5267 and 1.5300. A breakout from there opens the way to 1.5442 and 1.5600. Alternatively a move back down under 1.4924 would find supports at 1.4824 and 1.4660 as the August low. A loss of this level extends the control of sellers and opens the way to a test on 1.4600 area.