Category: Market Update
Geopolitical Tensions Escalate
Geopolitical tensions escalate into a full-scale invasion –
Regrettably, geopolitical tensions have peaked overnight into what appears to be a full-scale invasion of Ukraine. It appears very insignificant to be discussing the financial markets at times like this and we acknowledge that however we do feel obliged to keep our client base as well informed as possible on the currency markets and the broader implications on them.
Risk, has of course sold off across the board in the financial markets today – stock markets lower, bond markets higher, commodity prices higher ( supply chains cut off) – in particular, oil and gas higher, gold higher and safe-haven currency like the Dollar and CHF higher. Scanning the financial markets however this morning, currencies appeared to be initially quite well insulated, particularly relative to the moves seen in stock markets and bond markets. This was a short-lived calm and throughout the day risky currencies have been heavily sold, with the Dollar and Swiss Franc the stand out winners (losers).
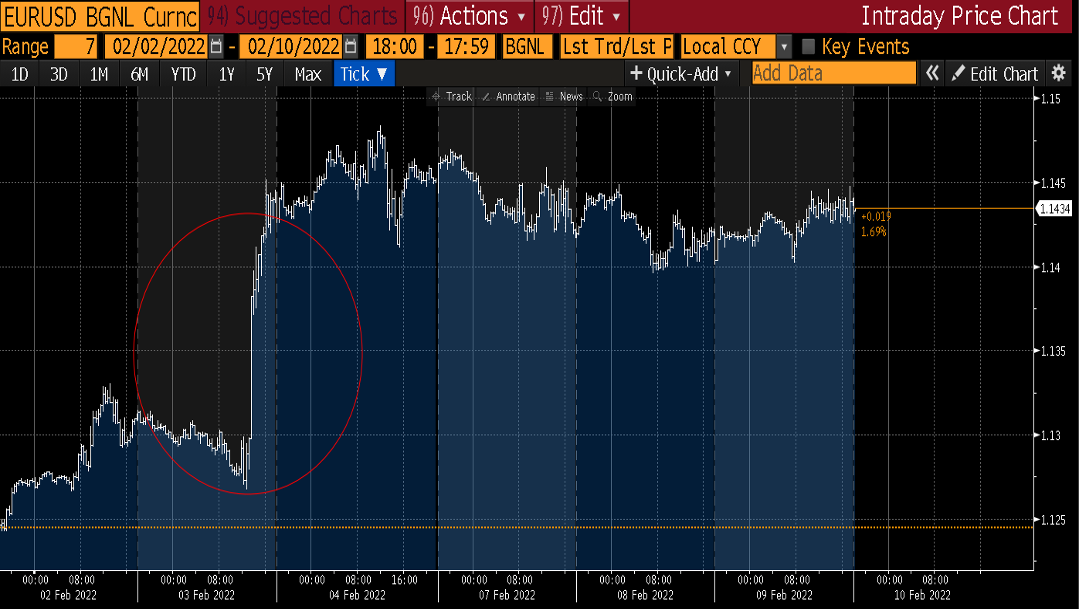
As one would expect this is very much a European issue at its core and we have seen that feed through into the single currency – The euro. EUR/USD has taken a significant hit on the day, selling off almost 2% from its overnight highs, to trade a low of 1.1106 – levels not seen since the summer of 2020
Daily Chart – EUR/USD –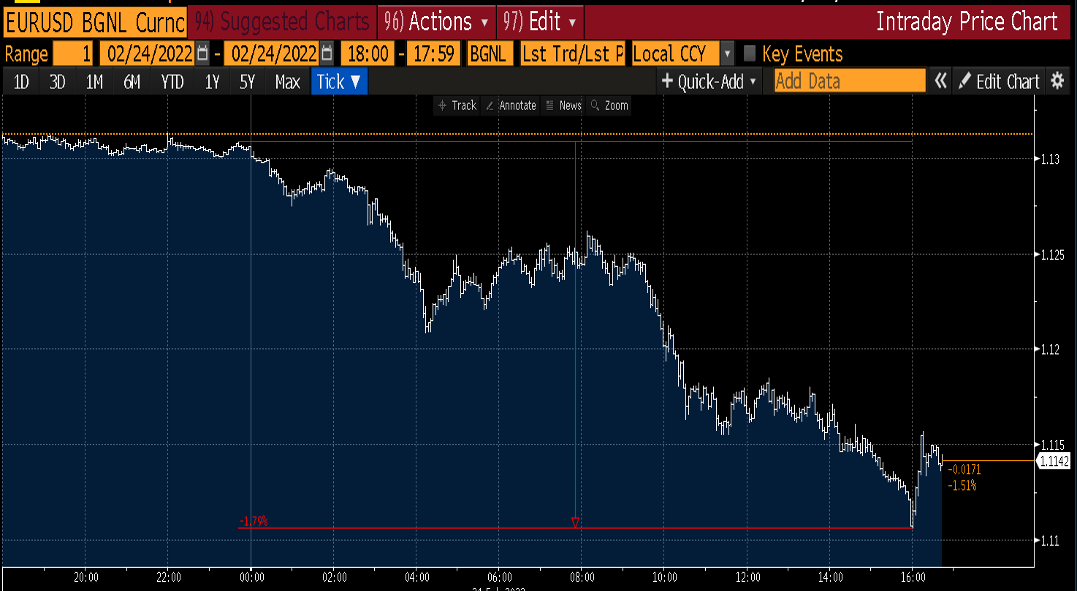
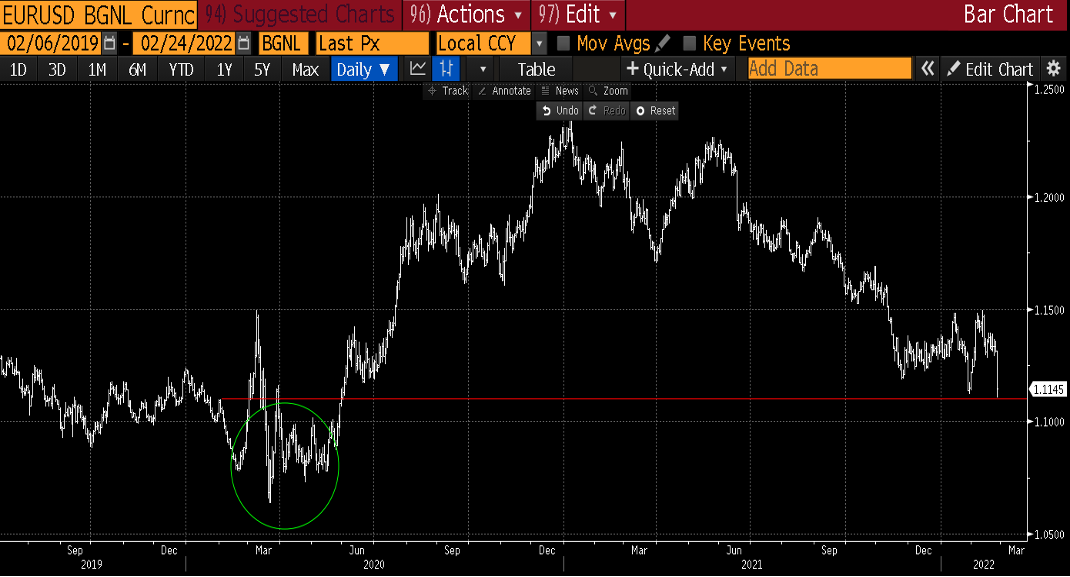
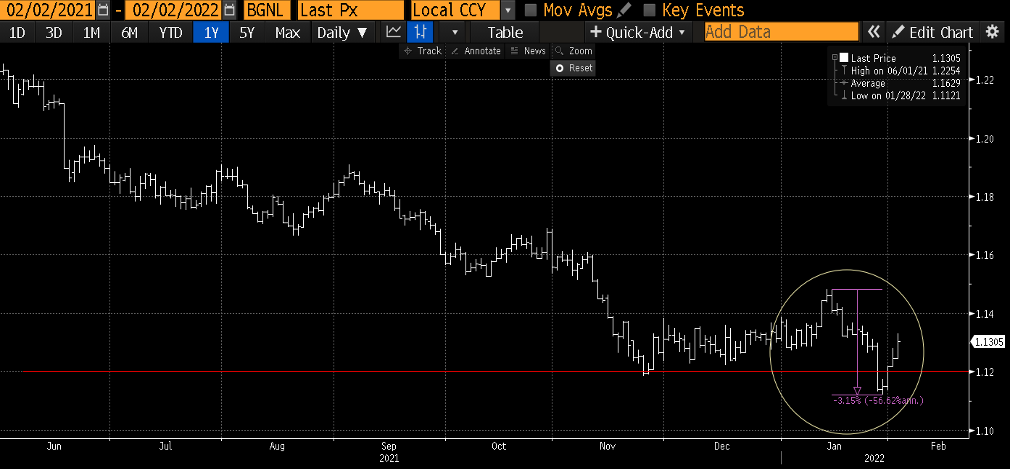
As can be seen from the longer-term chart below – we still have plenty of room on the downside to get back close to peak pandemic lows seen back in March/April 2020 and with plenty more room to play out in this narrative. Further downside cannot be ruled out. One such major risk event will be the full announcement of the allies’ sanctions on Russia and Putin’s reaction to these sanctions – we should have clarity on this within a few hours.
Longer Term Chart – EUR/USD
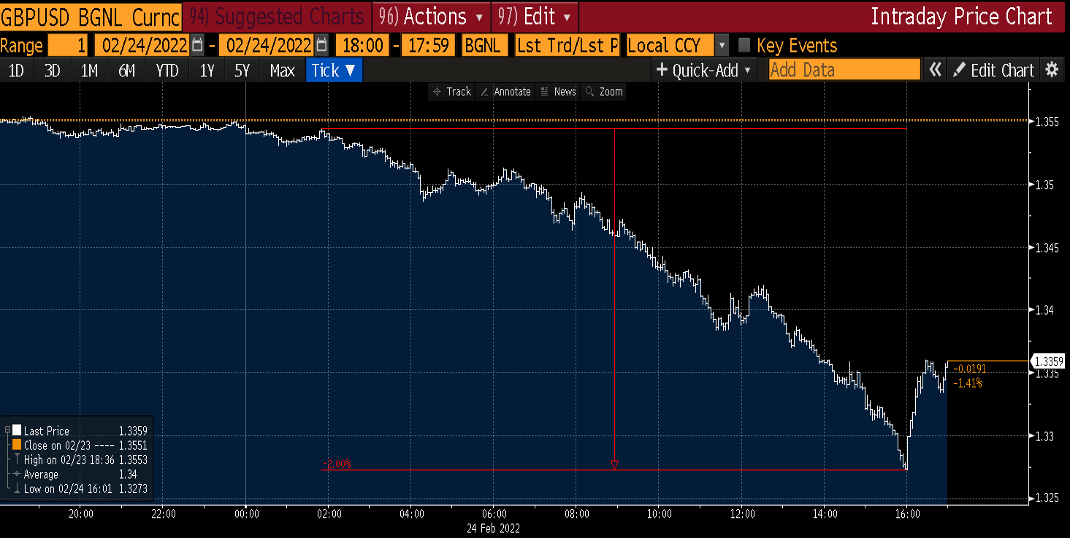
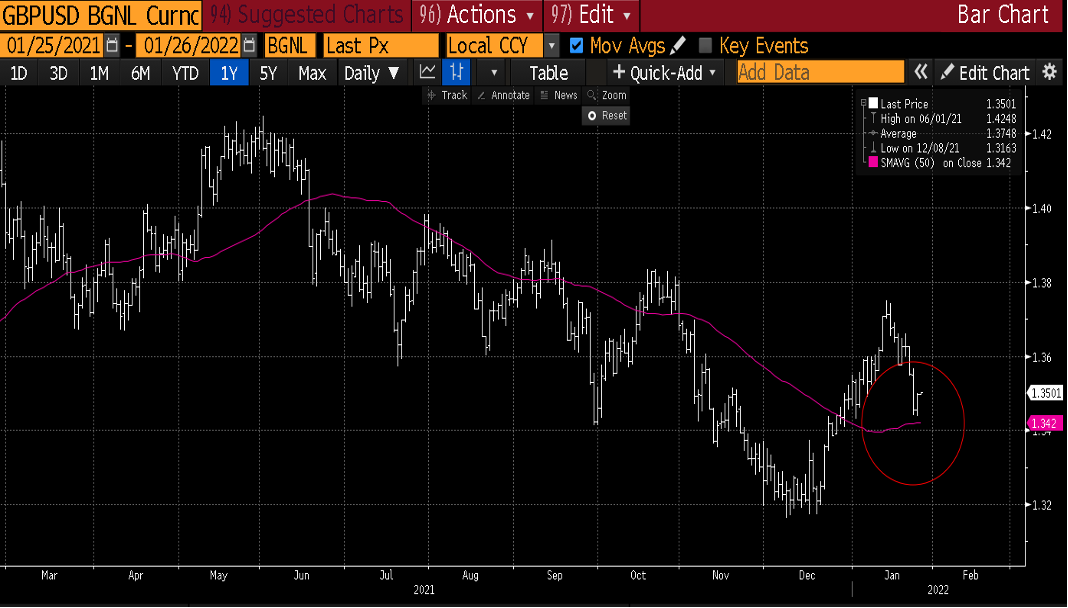
In addition to the Euro taking the brunt of the punishment today, Sterling has also felt the pain particularly versus the Dollar – a nice round 2% decline. The UK’s exposure to Russian wealth and its banking system explains this move.
Daily Chart – GBP/USD –
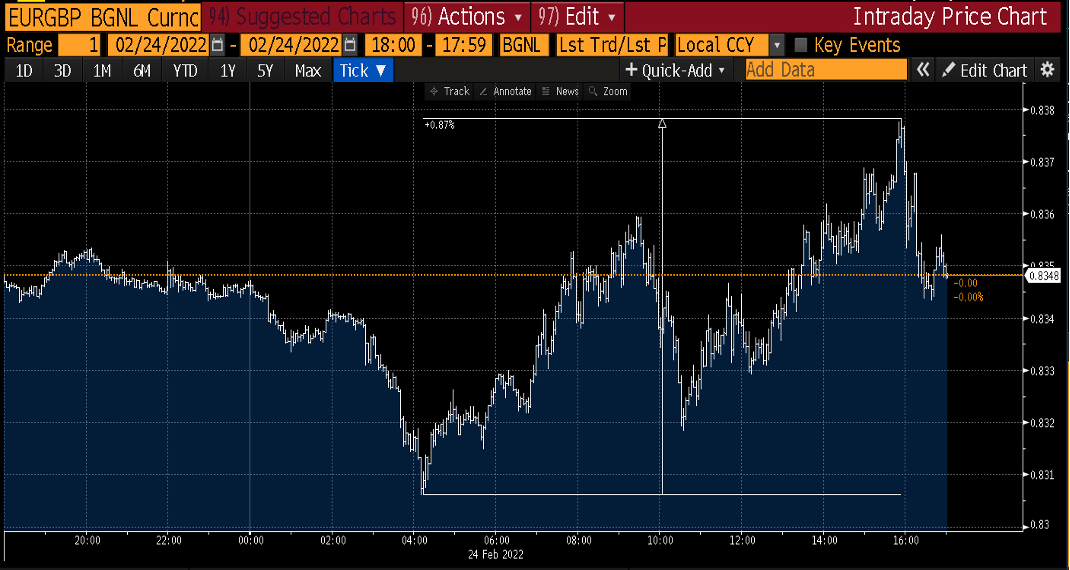
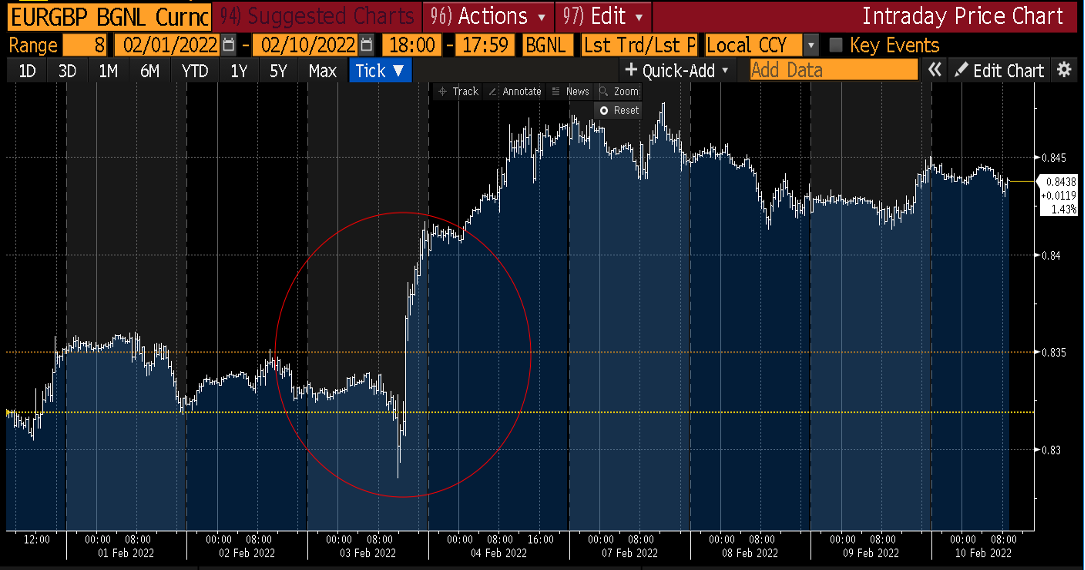
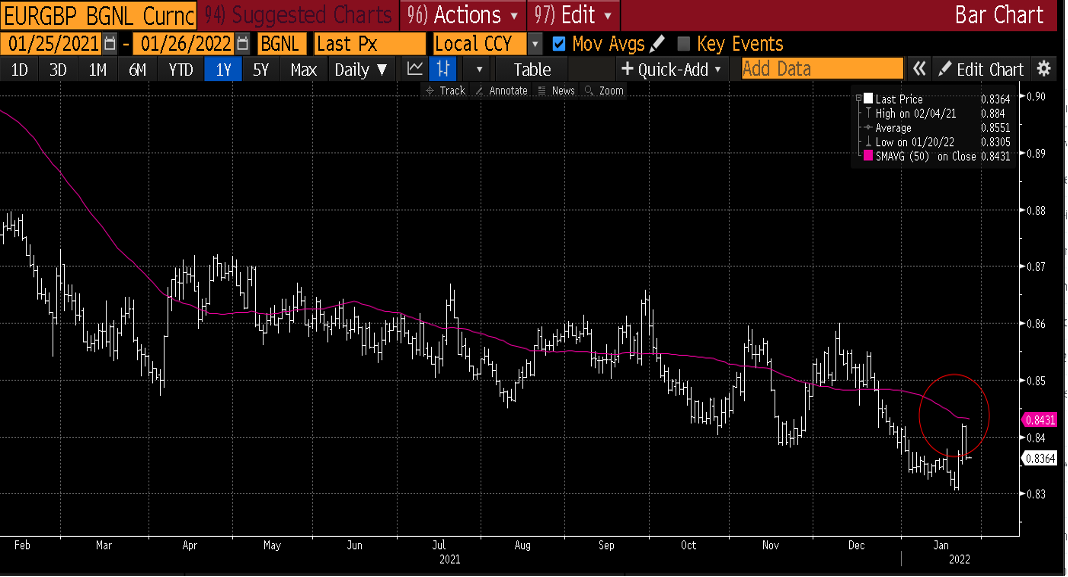
This dynamic, where both Sterling and Euro have sold off against the Dollar, has meant that for the time being EUR/GBP has been relatively stable on the day – see daily chart below.
Daily Chart – EUR/GBP –
Disclaimer
The content of this report is for information purposes only. Nothing in this report should be considered financial, investment, legal, tax or other advice nor should it be interpreted as a recommendation to buy or sell foreign currency or any other products or services. Readers must carefully make their own decisions based upon their specific objectives and financial positions.
Treasury First is powered by Assure Hedge (UK) Limited, a company incorporated in England and Wales (No.10723112) with its registered office at 45 Eagle Street, London WC1R 4FS, UK, is authorised and regulated by the Financial Conduct Authority of the UK (FRN:783837). Assure Hedge Limited, the parent company, is incorporated in Ireland (No. 578153) with its registered office at Dogpatch Labs, CHQ Building, North Wall Quay, Dublin 1, Ireland.
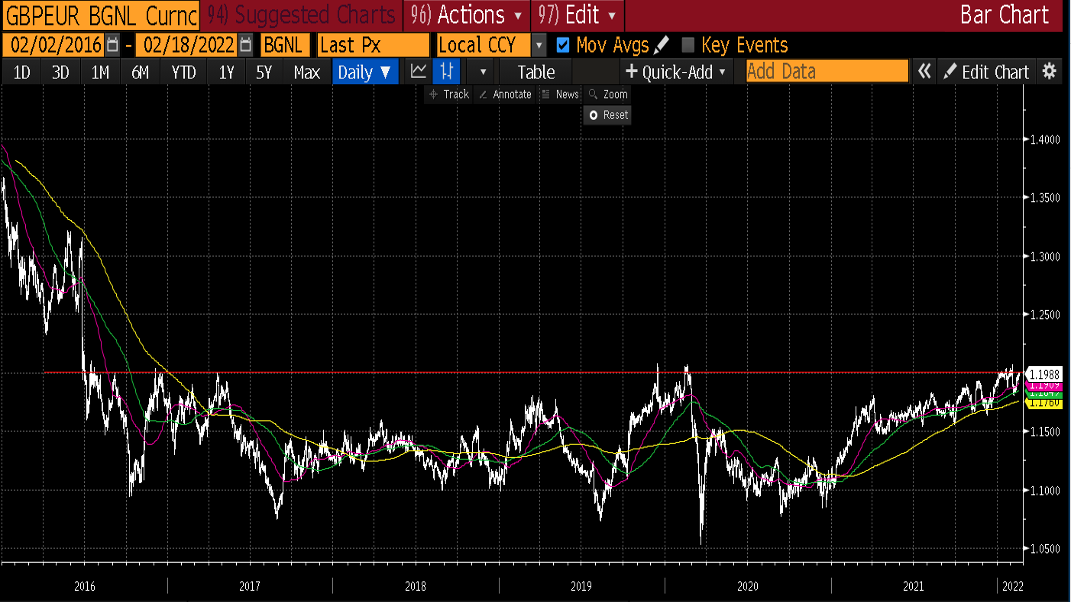
GBP/EUR – The 1.20 level acts as a magnet once again
GBP/EUR – The 1.20 level acts as a magnet once again
Regular readers of our currency market reports will know that we have been watching this psychological level in GBP/EUR at 1.20. This 1.20 level has defined the range since earlier Jan and had not been breached since the beginning of 2020. In fact, we have not been properly above this level since mid-2016 – pre-Brexit. See long term chart of GBP/EUR below –
Long Term Chart – GBP/EUR – 2016-2022
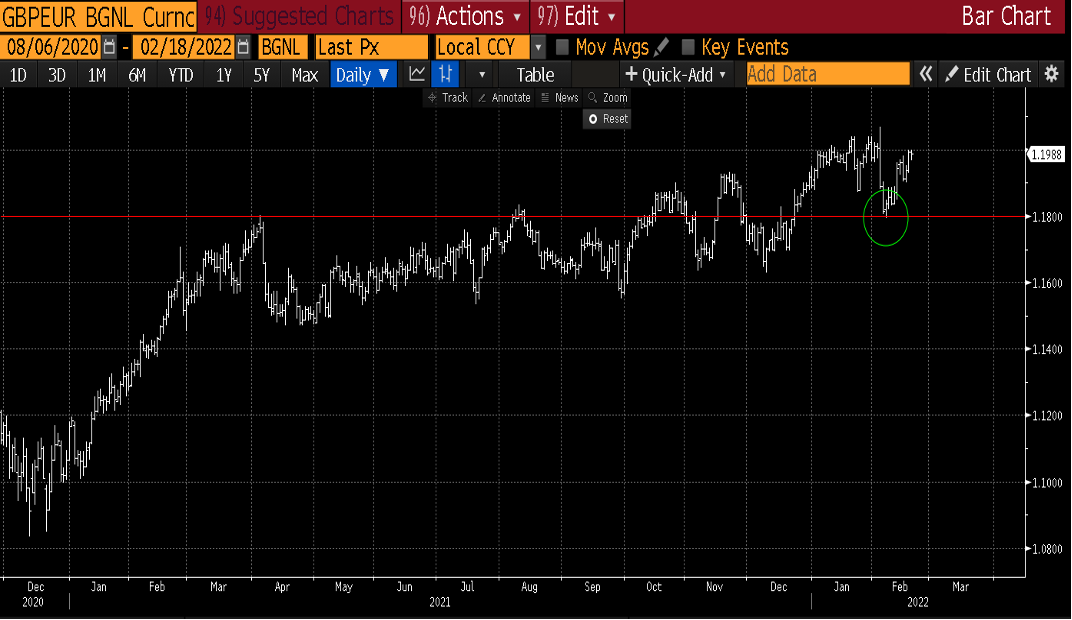
As mentioned previously we have been looking for clues as to whether we would get a continuation of the recent trend higher in GBP/EUR or if the resistance at this 1.20 level would cap the topside momentum and push us back into a lower range. The drama of the Bank of England and the ECB interest rate meetings at the beginning of the month looked to change the landscape somewhat. Although the Bank of England hiked rates, it was a dovish hike, which meant the currency only rallied briefly. The ECB however surprised the markets by opening the door on rate hikes – previously the belief had been the European Central Bank would be the last major central bank to increase rates. This threw the cat amongst the pigeons on the day and the following 2 trading sessions, with GBP/EUR falling back down to a low of 1.1795.
GBP/EUR – Lows post BOE and ECB rate decision meetings –
The market suddenly became very exciting about a more hawkish pivot by the ECB and given the high levels of GBP/EUR – began to sell Sterling and buy Euros.
Geopolitical tensions began to increase over the Ukraine situation over the past 2 weeks. As we have outlined before, traditionally this would be negative for Sterling. A risk-off environment historically tends to see Sterling weaken. This, combined with the actions of the ECB, was, in theory, the perfect storm for GBP/EUR lower. Surprisingly this has not been the case this week and instead of selling off, GBP/EUR has rallied back to this 1.20 magnet level.
There is plenty to still monitor and this maybe just a function of market positioning, however, a break and weekly close above this year’s highs at 1.2069, would be very significant – watch this space……
GBP/EUR – short term chart
Central Banks Take Centre Stage
Things just got complicated
Central Banks take centre stage
Last week saw some significant shifts in the central bank landscape in the G10 space, which have certainly complicated things somewhat. Last Thursday saw rate decision meetings from the Bank of England and ECB, which threw up several surprises, to say the least, and which have had major vibrations amongst global asset classes, none more so than the FX currency markets.
Proceedings were kicked off by the Bank of England, as they hiked interest rates by 25 bps to 0.5%, as was expected by the markets. What was not expected was that 4 out of the 9 member Monetary Policy Committee (MPC), whose job it is to set interest rates, voted for a 50 bps hike in rates – this close call – 4 to 5 votes in favour of a 50 bps hike, would have been a huge surprise for the markets. This voting dynamic amongst the members of the MPC gives the market a good insight into what may be coming down the line from the Bank of England. As expected Sterling rallied on the announcement – see chart below – however, its momentum was halted for two reasons;
GBP/USD – post-BOE interest rate increase
- Comments from the Governor of the Bank of England during the press conference post the rate decision – Governor Bailey suggested the rise in interest rates was purely down to inflation and not an overheating of the UK economy and such hikes could have a significant impact on real household incomes going forward – in market terms this was a ‘’dovish hike’’ by the central bank.
- The shift in policy stance by the ECB – caused EUR/GBP to rally and GBP/USD to halt in its tracks – more on this below >>
Post the Bank of England it was the turn of the ECB to take centre stage with their rate announcement on Thursday– with the market’s expectations firmly in the camp that Lagarde would stick to her mantra – ‘’no change, playing a straight bat, let’s see how things are in March at the next meeting when we will have the new economic projections from the ECB economists’’. Well, that was a mistake, as the ECB went from never hiking interest rates and Euro being the perennial funder, to Lagarde sighting inflation as a real concern in her press conference and opening the door to future rate hikes. This is a huge pivot for the ECB, which occupied the most dovish central bank category along with the SNB and the BOJ. Markets immediately began to price in rate hikes this year and the Euro rallied hard versus most currencies – in particularly the Dollar and Sterling. See chart of EUR/USD and EUR/GBP below – The market is now pricing in up to 35 bps of interest rate hikes into Dec 2022 – if this was to increase, we could see a significant move in the Euro across the board…. Watch this space.
EUR/USD – post-ECB hawkish pivot
EUR/GBP – post-ECB hawkish pivot
Disclaimer
The content of this report is for information purposes only. Nothing in this report should be considered financial, investment, legal, tax or other advice nor should it be interpreted as a recommendation to buy or sell foreign currency or any other products or services. Readers must carefully make their own decisions based upon their specific objectives and financial positions.
Treasury First is powered by Assure Hedge (UK) Limited, a company incorporated in England and Wales (No.10723112) with its registered office at 45 Eagle Street, London WC1R 4FS, UK, is authorised and regulated by the Financial Conduct Authority of the UK (FRN:783837). Assure Hedge Limited, the parent company, is incorporated in Ireland (No. 578153) with its registered office at Dogpatch Labs, CHQ Building, North Wall Quay, Dublin 1, Ireland.
Central Bank Decisions
Increased Volatility in Currency Markets
We continue to focus on EUR/USD, GBP/USD, and EUR/GBP
Avid readers of our weekly currency report will know we have highlighted the importance of the central bank in the coming 12 months and how their actions surrounding interest rates and the tightening of monetary policy will have a significant impact on the currency markets. We believe that as central banks increase interest rates, we should see an increase in FX volatility – interest rate differentials being one of the major drivers of global currencies.
Our first interlude into this theory was proved correct, as we saw huge Dollar buying post the Federal Reserve meeting last Wednesday – see chart below for the move lower in EUR/USD. The Fed Chair Powell delivered a more hawkish speech during the press conference after which the market has subsequently priced in more US interest rate hikes for 2022 than was previously thought.
EUR/USD sells off-post-Federal Reserve Meeting – over 3%…….
What a difference a week makes –
The market’s fickle nature has kicked in this week, as it now turns its attention to the two central bank meetings today – the Bank of England and ECB.
Although in theory, both central banks are at very different stages on the monetary policy curve, the market is getting excited about both, and the Euro and the Pound have rallied back this week versus the Dollar.
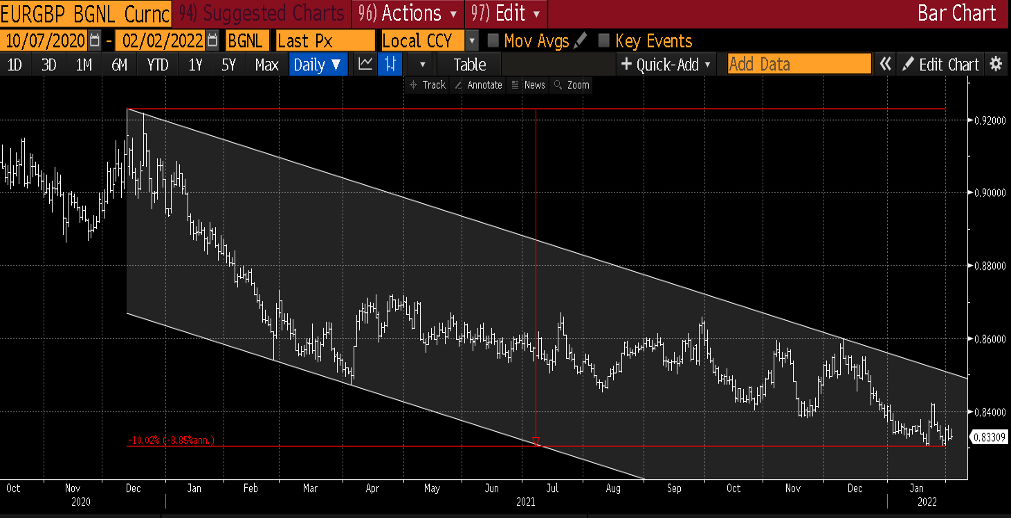
Bank of England – a full 25 bps hike is priced in by the market for the BOE today, which would bring interest rates in the UK to 0.5% – noon London time. With 25 bps pretty much a done deal we feel, the question then arises as to whether this is a hawkish hike by the central bank, indicating there are more hikes around the corner or whether they will adopt a more cautious approach. A hawkish hike should lead to an appreciation of the currency and in particular versus the Euro. The hike would increase the interest rate differential between the UK and the Eurozone. We have already seen a strong downtrend emerge in EUR/GBP over the past 12 months or so – where the Sterling has gained in strength versus the Euro – this trend could well continue if the BOE produce a hawkish interest rate hike today – see chart
EUR/GBP – downtrend – GBP strength – 10% since Dec 2020
We also get the interest rate decision from the ECB and Lagarde today where no change in monetary policy is expected – 12.45 pm London time. There are however some elements of the market that are looking for the ECB council to acknowledge the inflation pressures in Europe and to possibly pivot more hawkish in their outlook…… watch this space…..
Sterling in Focus
Sterling in Focus this week
The global stocks markets and in particular the US stock markets are experiencing very high volatility to start the year off. A combination of geopolitical woes – the Ukrainian crisis and rising global interest rates are behind this volatility. This unease in the markets is filtering through in other asset classes and currencies are not immune to the unrest.
During periods of high volatility and ‘’risk-off’’ in the financial markets, Sterling historically tends to trade badly. GBP/USD will trade lower and EUR/GBP will trade higher. We are seeing this pattern emerge over the past few days as global equity markets take a tumble – from its highs in January the Nasdaq 100 has sold off over 17%. Given Sterling’s rally so far in January, this brings the Pound into focus this week and it fights several potential headwinds.
In the chart below we can see how Sterling has sold off over the past few trading sessions and is also approaching its 50 day moving average in GBP/USD.
The volatility in the financial markets is of concern for Sterling bulls as highlighted above, however, there are several Sterling centric issues also coming into play this week.
Market positioning – the pound had started 2022 with the market holding a heavy short position. We failed to make any further progress lower and these positions got squeezed out, as Sterling began to rally at the beginning of the year. This positioning has largely been washed out of the market and is no longer acting as a Sterling positive. As we approach the end of the month, the natural flow dynamics of the market have changed. Firstly the FTSE has been a stand-out performer in the global equity space in January and therefore we should see Sterling supply in the markets as Global portfolio managers rebalance their books at the end of the month. We should also see some Sterling supply as BHP Billiton removes its dual listing in the UK.
Now thrown in on top of all this, the political folly surrounding Boris Johnson in the UK and the Gray report, with a potential leadership challenge, and we could well have the perfect storm for a lower pound into month-end. Watch this space…..
From the chart below we can see how Sterling has sold off and Euro has rallied in the face of increased financial volatility – the 50 day moving average – line in pink – is now acting as technical resistance.
Disclaimer
The content of this report is for information purposes only. Nothing in this report should be considered financial, investment, legal, tax or other advice nor should it be interpreted as a recommendation to buy or sell foreign currency or any other products or services. Readers must carefully make their own decisions based upon their specific objectives and financial positions.
Treasury First is powered by Assure Hedge (UK) Limited, a company incorporated in England and Wales (No.10723112) with its registered office at 45 Eagle Street, London WC1R 4FS, UK, is authorised and regulated by the Financial Conduct Authority of the UK (FRN:783837). Assure Hedge Limited, the parent company, is incorporated in Ireland (No. 578153) with its registered office at Dogpatch Labs, CHQ Building, North Wall Quay, Dublin 1, Ireland.
Central Banks Continue to Dominate
Central Banks Continue to Dominate
Following on from our report last week, we will start today’s currency report by checking in on EUR/GBP. We mentioned last week that we would be monitoring this currency pair closely for signs of a continuation of the trend lower in Euro and of course conversely higher in Sterling.
We mention this all important 1.20 level in GBP/EUR terms, which comes in at 0.8333 in EUR/GBP. We have attempted to break the level and close below since the first trading day of January – however, we have failed to get a close below the 0.8333/above 1.20. As you can now see from the chart below – technically it would appear that EUR/GBP is forming a short term base at 0.8333 and now looking to break out of the recent range to the topside. 0.8381 is now the pivot to the topside and should provide initial resistance.
A clean break above this level opens up the 0.84 zone, a break of which would add further momentum to the topside. The overall medium term down trend in EUR/GBP is still intact, however, given we could not break and close below 0.8333 (GBP/EUR 1.20) in the short term, may mean we see a bounce in EUR/GBP for a week or so, before we can resume the downtrend.

The dominant theme for 2022 will be the actions of global central banks and the enormous impact these actions will have on the financial markets. Global central banks are pivoting away from monetary stimulus, with many signaling they are entering the beginning of an interest rate hike cycle – mostly notably the US Federal Reserve.
We have become accustomed to interest rates at zero and low levels of volatility in the currency markets over the past number of years. With central banks indicating they are looking to increase interest rates and therefore interest rate differentials coming into play amongst currency pairs, we should in theory see increased volatility in the currency markets over the course of 2022.
The market can get a little ahead of itself with this theme as seen in EUR/USD over the past number of trading sessions. Euro has rallied since early last week – nearly 2%, as the market turned its attention to the ECB and its concern over rising inflation – see chart.
It appears that the market was too quick to place the ECB into the bucket of central banks on the verge of hiking and we have seen a subsequent retracement of the rally last week. This now appears to be a false break higher in Euro as we fall back below the important pivot at 1.1380 – see chart.

Disclaimer
The content of this report is for information purposes only. Nothing in this report should be considered financial, investment, legal, tax or other advice nor should it be interpreted as a recommendation to buy or sell foreign currency or any other products or services. Readers must carefully make their own decisions based upon their specific objectives and financial positions.
Treasury First is powered by Assure Hedge (UK) Limited, a company incorporated in England and Wales (No.10723112) with its registered office at 45 Eagle Street, London WC1R 4FS, UK, is authorised and regulated by the Financial Conduct Authority of the UK (FRN:783837). Assure Hedge Limited, the parent company, is incorporated in Ireland (No. 578153) with its registered office at Dogpatch Labs, CHQ Building, North Wall Quay, Dublin 1, Ireland.
Sterling Hits 1.20
Sterling Hits 1.20, can it go any further?
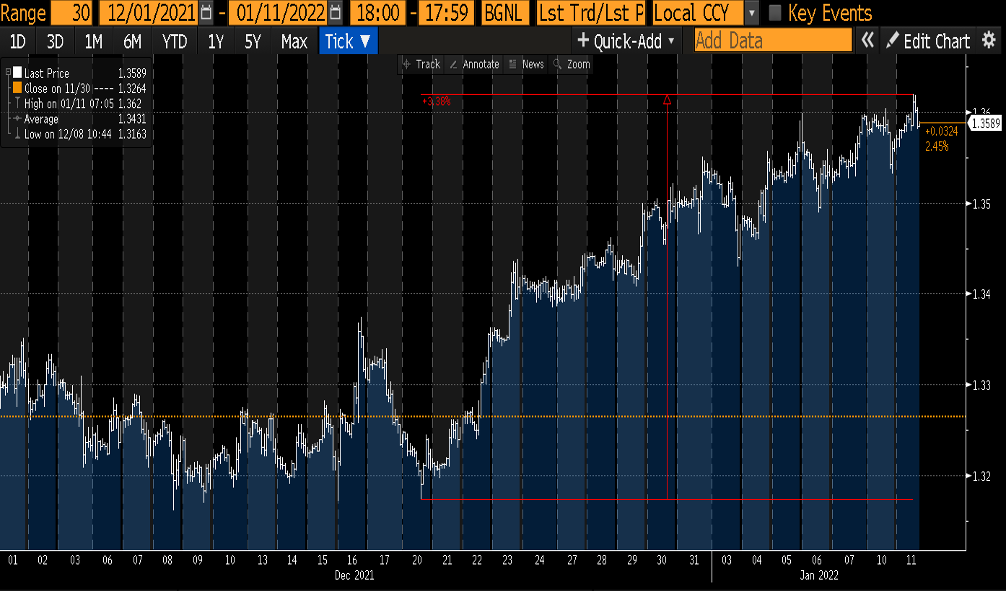
The New Year has brought a further bout of Sterling strength in the currency markets. This strength initially manifested itself in GBP/USD over the festive period as can been seen from the short term chart below – Dec 20th onwards and subsequently filtered through into GBP/EUR – higher Sterling
GBP/EUR has a seasonal tendency to trend in the first couple of months of the year and in this case we are seeing a further extension to the higher trend that emerged at the beginning of last year. There are of course many reasons to be bearish Sterling as a whole, however as it stands, we are potentially seeing a trend higher in Sterling emerge. This trend is not confirmed as of yet and we will be watching a number of indicators over the coming weeks closely – which we will highlight – that should confirm or not the higher GBP/EUR trade.
The first of these sign posts is the big technical level in GBP/EUR at 1.20 – this equates to 0.8333 in EUR/GBP terms. This is a huge psychological level in the currency pair and as can be seen from the longer term chart below, a level we have not been above in over 20 months.

We have made a number of attempts to clear this level since the beginning of the year – each day since the 4th Jan we have hit resistance near 1.20 – see short term GBP/EUR chart below. It is very likely that the reason behind these failed attempts at the 1.20 level has been Sterling supply from the corporate world. Traditionally the corporate sector will hedge their FX exposure in and around important levels like 1.20. Given we have not been at this level in over 20 months, it makes sense that Treasurers are using this opportunity to off load their pounds at good levels and mitigate their FX exposure.
So this is our first major sign post that will help indicate whether we are in a larger up-trend in GBP/EUR or whether we will fall back into the range. A weekly close above 1.20 is needed – watch this space.
Treasury First is powered by Assure Hedge (UK) Limited, a company incorporated in England and Wales (No.10723112) with its registered office at 45 Eagle Street, London WC1R 4FS, UK, is authorised and regulated by the Financial Conduct Authority of the UK (FRN:783837). Assure Hedge Limited, the parent company, is incorporated in Ireland (No. 578153) with its registered office at Dogpatch Labs, CHQ Building, North Wall Quay, Dublin 1, Ireland.
This email and any files transmitted with it are confidential and intended solely for the use of the individual or entity to whom it is addressed. If you have received this email in error, immediately notify the sender by reply email and then permanently delete this email and your reply. Unauthorised use, disclosure, storage or copying of this email is not permitted. Whilst every endeavour is taken to ensure that emails are free from viruses, no liability can be accepted for any damage arising from using this email. Treasury First does not guarantee the accuracy or reliability of information in this message, and any views expressed are not necessarily the views of the company.
Treasury First – Mid Week Macro Report 07th October 2021
Treasury First – Mid Week Macro Report 07th October 2021
The markets have recovered well from their risk off environment that clouded the beginning of the week, as comments from Putin and US Oil Inventory data yesterday helped to calm nerves in the commodity space and a potential compromise on the Debt Ceiling in the US from McConnell – have given stocks a boast. The market as always has one eye on the rally in bond yields – global bond yields – as more and more Central Banks make that hawkish shift in their stance. There are a number of factors affecting the rise in yields such as inflation concerns, supply chain issues and rising commodity prices, alongside of course the US debt limit. Markets are also focussed on the tapering of asset purchase programmes that were launched in response to the Covid-19 outbreak last year and the longer term view on interest rates. The Reserve Bank of New Zealand raised rates to 0.5% from 0.25% on Wednesday as the country grapples with its worse Covid-19 outbreak to date. This was followed by a surprise interest hike by 40 bps by the National Bank of Poland yesterday afternoon – the global interest rate market is shifting and as we have pointed out many times on this report – this has huge implications for all financial asset classes.
Energy prices are continuing to rise and are driving global inflation higher as we head into the winter. This has been extremely evident in the UK of late, who is also being affected by a lack of workers across all sectors of the economy. With the shortfall of workers in the supply chain ahead of the busy Christmas season, the outlook for the UK remains tough and is expected to worsen unless the government take drastic action. However Prime Minister Johnson has denied that Britain is facing an economic crisis and dismissed the shortages as a “predictable consequence of emerging from the coronavirus pandemic” but said it was not his job to fix all the problems businesses face, and said he was not worried about rising energy prices and labour shortages.
We get US monthly employment figures out tomorrow – 1.30pm London time. Non-Farm Payrolls will be the key risk event for the markets this week and should set the tone for the remainder of Oct. Fed Chair Powell has already told the markets that the Fed will be watching tomorrow’s figures closely, however he did caveat this by suggesting that the bar is not high for tomorrow’s figures and therefore a slight miss to expectations should still keep the tapering process on track by the Fed for Nov. A beat tomorrow on the release and we should see US yields climb higher, equities get hit and the Dollar rally.
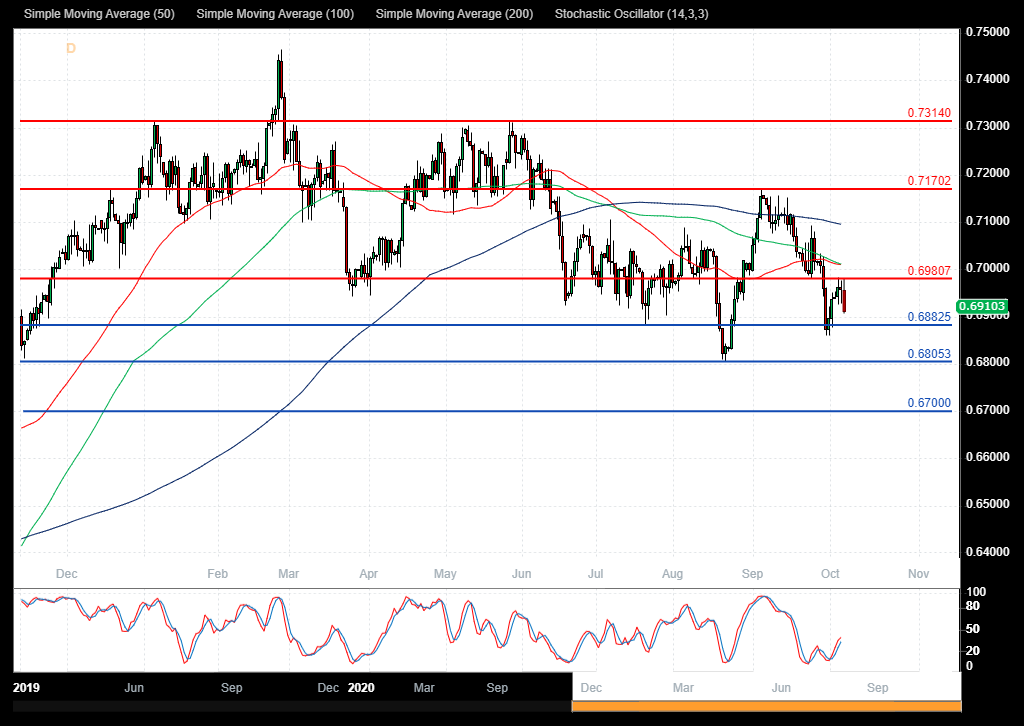
NZDUSD
The NZDUSD FX pair is trading at 0.6908 after breaking below the 0.7000 level as support and testing lower to the 0.6860 area last week. Price tested resistance at the 0.7170 area in September and rejected lower. The pair is pushing lower today after the RBNZ raised interest rates. Price is using the 0.6980 area as resistance in the short term. A confirmed breakout above this level and the 50 SMA, opens the way to resistance at the 0.7100 area and the 200 SMA. Alternatively a move back down under 0.6880 opens the way to support at 0.6800. This area of support is followed by further supports at 0.6700 and 0.6640.
UK 100 Index
The UK 100 Index has consolidated over recent months and is now testing the support area of the last higher low around 7000.00. The 6800.00 area of support is corresponding to the neckline for a head and shoulders pattern. A selloff below that area would trigger the pattern with a target around 6350.00. The pattern would become invalid with a move back above 7159.00 and a push over 7235.00. If the market breaks above the resistance area at 7076.00, the way opens back to the high at 7157.00. Alternatively, a move back below 6950.00 signals a test on the support at 6900.00 The 6855.00 area then becomes supportive followed by the 6800.00 round number level. Below this level the 6615.00 area would be used as support along with 6470.00 as a significant higher low.

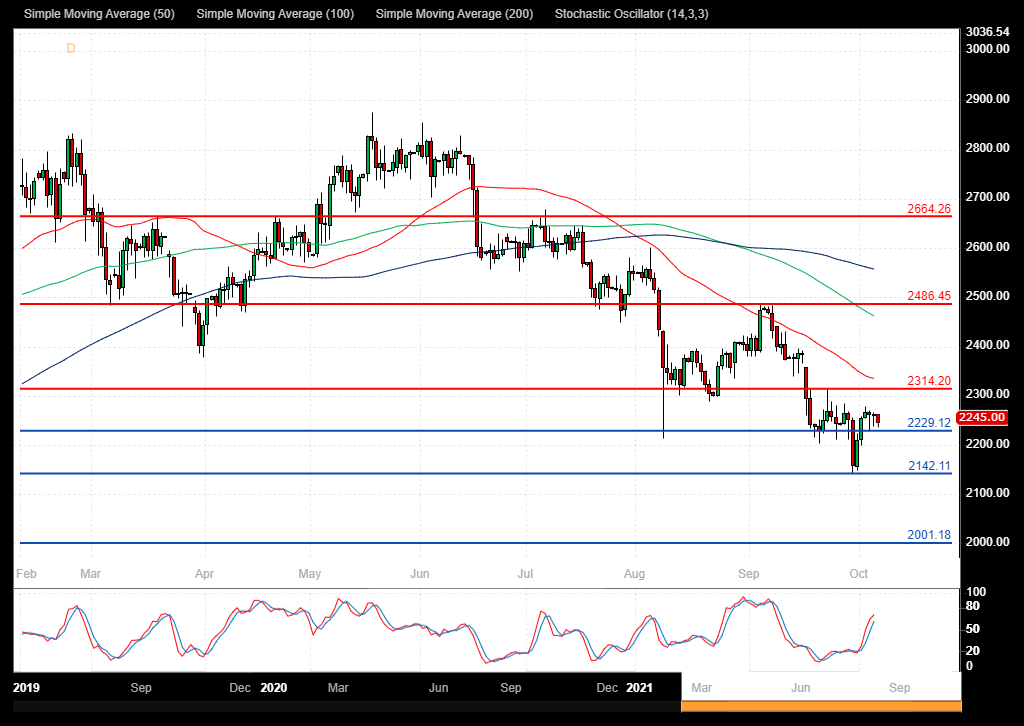
Silver
The Silver chart is showing how the price has sold off to test support at 2142.00. With price now trading at 2230.00, resistance can be seen at 2275.00 and support at 2200.00. The 2314.00 area is expected to act as resistance in the short term as it relates to the lower high. A break above this level would find resistance ahead of 2485.00 lower high. A continued move higher finds more resistance around the 2600.00 and 2660.00. A breakout from there opens the way to 2875.00. Alternatively a move back down under 2200.00 would find supports at 2142.00 and 2100.00. A loss of this level extends the control of sellers and opens the way to a test on 2000.00 area.
Treasury First – Mid Week Macro Report 29th September 2021
Treasury First – Mid Week Macro Report 29th September 2021
The markets are focussing on global bond markets and the rise in yields at present with equities declining and a general tone of risk aversion entering the space. The risk off tone is being particularly badly felt in the tech sector with a rotation out of tech and into value taking place in equities. This was very evident in the Nasdaq yesterday, which was the worst performing of the US stock markets. The Nasdaq felt this rotation and was compounded by its sensitivity to higher rates. Energy commodities softened a little after they rallied hard in recent days. However with fuel shortages in the UK and higher prices across the energy block, it is anticipated that prices will continue to rise into the winter. This is being coupled with supply and distribution disturbances across many sectors, further increasing prices and signalling continued rising inflation. The US Federal Reserve has signalled that it will taper asset purchases and the prospect of rate increases are already being discussed but in the context of the first rate hike taking place in 2023. Rampant rises in inflation may bring forward the timeline for hikes. As the end of the month/quarter approaches, traders, corporates and fund managers will be rebalancing their positions and this may result in some more unusual moves across markets. Volatility should increase over the next 2 days and create exaggerated moves, which in turn can bring good trading opportunities. Good luck out there.
GBPUSD
The GBPUSD FX pair is trading at 1.3520 after breaking below the 1.3600 level as support and testing lower to the 1.3500 area overnight. Price tested resistance at the 1.4250 area in June creating a double top. The pair is pushing lower this week after running into resistance around 1.3900 and consolidating. Price is using the 1.3700 area as resistance in the short term. A confirmed breakout above this level and the 50 SMA, opens the way to resistance at the 1.3850 area followed by 1.3900 as the 200 SMA followed by the 1.4000 area. Alternatively a move back down under 1.3500 opens the way to support at 1.3450. This area of support is followed by further supports at 1.3300 and 1.3185.

US 100 Index
The US 100 Index created a high at 15700.00 last month and is now testing the support area of the last higher low around 14800.00. The area of support is corresponding to the neckline for a head and shoulders pattern that has triggered with a loss of 14900.00. The pattern would become invalid with a move back above 15179.00 and a push over 15500.00. If the market breaks above the resistance area at 15416.00, the way opens back to the high at 15711.00. Further resistance comes onto the chart at 15900.00 ahead of 16000.00. Alternatively, a move back below 14750.00 signals a test on the support at 14450.00 The 14230.00 area then becomes supportive followed by the 14000.00 round number level. Below this level the 13965.00 area would be used as support along with 13480.00 as a significant higher low.

Crude Oil
The Crude Oil chart is showing how the price has moved back up to test the former high around 7650.00 after reaching a higher low at 6200.00 in August. With price now trading at 7375.00 as it resistance can be seen at 7500.00 and support at 7270.00. The 7600.00 area is expected to act as resistance in the short term as it relates to the July high. A break above this level would find resistance ahead of 7650.00 as that high. A continued move higher finds more resistance around the 7700.00 and 7760.00. A breakout from there opens the way to 7800.00. Alternatively a move back down under 7270.00 would find supports at 7040.00 and 7000.00. A loss of this level extends the control of sellers and opens the way to a test on 6730.00 area.

Treasury First – Mid Week Macro Report 22 September 2021
Treasury First – Mid Week Macro Report 22 September 2021
The Chinese Evergrande Group is continuing to dominate markets with the latest news that it will pay its interest coupons tomorrow that are maturing on its onshore bonds – nothing has been mentioned regarding the interest repayments on their off-shore bonds. The news has sparked another leg higher in the risk rally off of Monday’s low – particularly seen in global equities. However, the risks around the group are still elevated and there is some concern that foreign debt will not be serviced. The real concern is how the Chinese authorities will deal with this issue and if it can spill over into the wider Chinese property market and into global credit markets. The markets are being helped in their risk on approach today ahead of the other key event this week, the FOMC meeting – this evening at 7.00 pm London time. The FOMC is expected to leave its rates unchanged but may signal a more positive shift in economic sentiment and Covid-19 cases as setting up the market for a taper of asset purchases. An official announcement of this is not expected until November at the earliest but the market will look for hints that a taper is on the cards in order to position for such an event. The other interesting element of tonight’s meeting will be the release of the new economic projections from the committee members, taking in 2024. The thing to watch here is the ‘’dot plot’’ – the projections of each member of the committee on the interest rate hiking cycle. All eyes on whether enough members see a lift-off to interest rates by the end of 2022 – this would be interpreted as hawkish by the markets. At present, the market is relatively calm with an upside bias. In the FX space, the volatility in recent days has subsided to some degree and markets are awaiting developments from the FOMC.
EURUSD
The EURUSD FX pair is trading at 1.1730 after breaking below the 50 SMA as support and testing lower to the 1.1700 area on Monday. Price tested resistance at the 1.1750 level in July creating a lower area of support and this is being tested as near term resistance. The pair is consolidating around 1.1800 running into resistance around 1.1900 and support around 1.1700/1.1650. Price is using the 50 SMA area as resistance in the short term at 1.1800. A confirmed breakout above this level and the 100 SMA, opens the way to resistance at the 1.1875 area followed by 1.1900. The 1.1950 area may then be resistive as the 200 SMA followed by the 1.2000 area. Alternatively, a move back down under 1.1700 opens the way to support at 1.1650. This area of support is followed by further supports at 1.1600 and 1.1570.
Wall St 30 Index
The Wall St 30 Index created a high at 35640.00 last month and is now testing the support area of the last higher low around 33750.00 after breaking the rising trend line at 34900.00 area earlier this month. The price tried to hold onto the 100 SMA last week but support gave way at 34500.00. If the market breaks above the resistance area at 34200.00, the way opens back to 3450.00. Further resistance comes onto the chart at 34800.00 and 35000.00. Alternatively, a move back below 34000.00 signals a test on the support at 33800.00 The 33600.00 area then becomes supportive followed by the 33000.00 round number level. Below this level, the 32566.00 area would be used as support along with 32030.00 as a significantly higher low.

Gold
The Gold chart is showing how the pair has consolidated over recent weeks after reaching a lower high at 1916.00 in June and finding support at 1667.00 in August. With price now trading at 1775.00 as it consolidates after bouncing from support at 1741.60. The 1800.00 area is expected to act as resistance in the short term as it contains the moving averages. A break above this level would find resistance ahead of 1835.00. A continued move higher finds more resistance around 1865.00 and 1877.00. A breakout from there opens the way to 1900.00 and 1916.00. Alternatively, a move back down under 1741.00 would find support at 1700.00 and 1667.00 as the August low. A loss of this level extends the control of sellers and opens the way to a test on the 1600.00 area.
